which indicator you find most usefull accd. to your analysis?
3 Likes
Exponential Moving Average
I like it because in my trading career “Exponential Moving Average” helped me to stay on right side while bigger moves and you know those are very easy to understand and use.
1 Like
Exponential Moving Average (EMA)
The only Indicators I use is Set of EMA’s.
Some Indicators can Give you false signals But EMA will never Cheat you.
EMA is Trustworthy.
EMA(3,5), MACD, RSI and ADX
But only for 1 st entry of the day.
Then onwards it’s just price action and volume with pivot points support and resistance.
I also always use ORB on 15 min candle with volume
1 Like
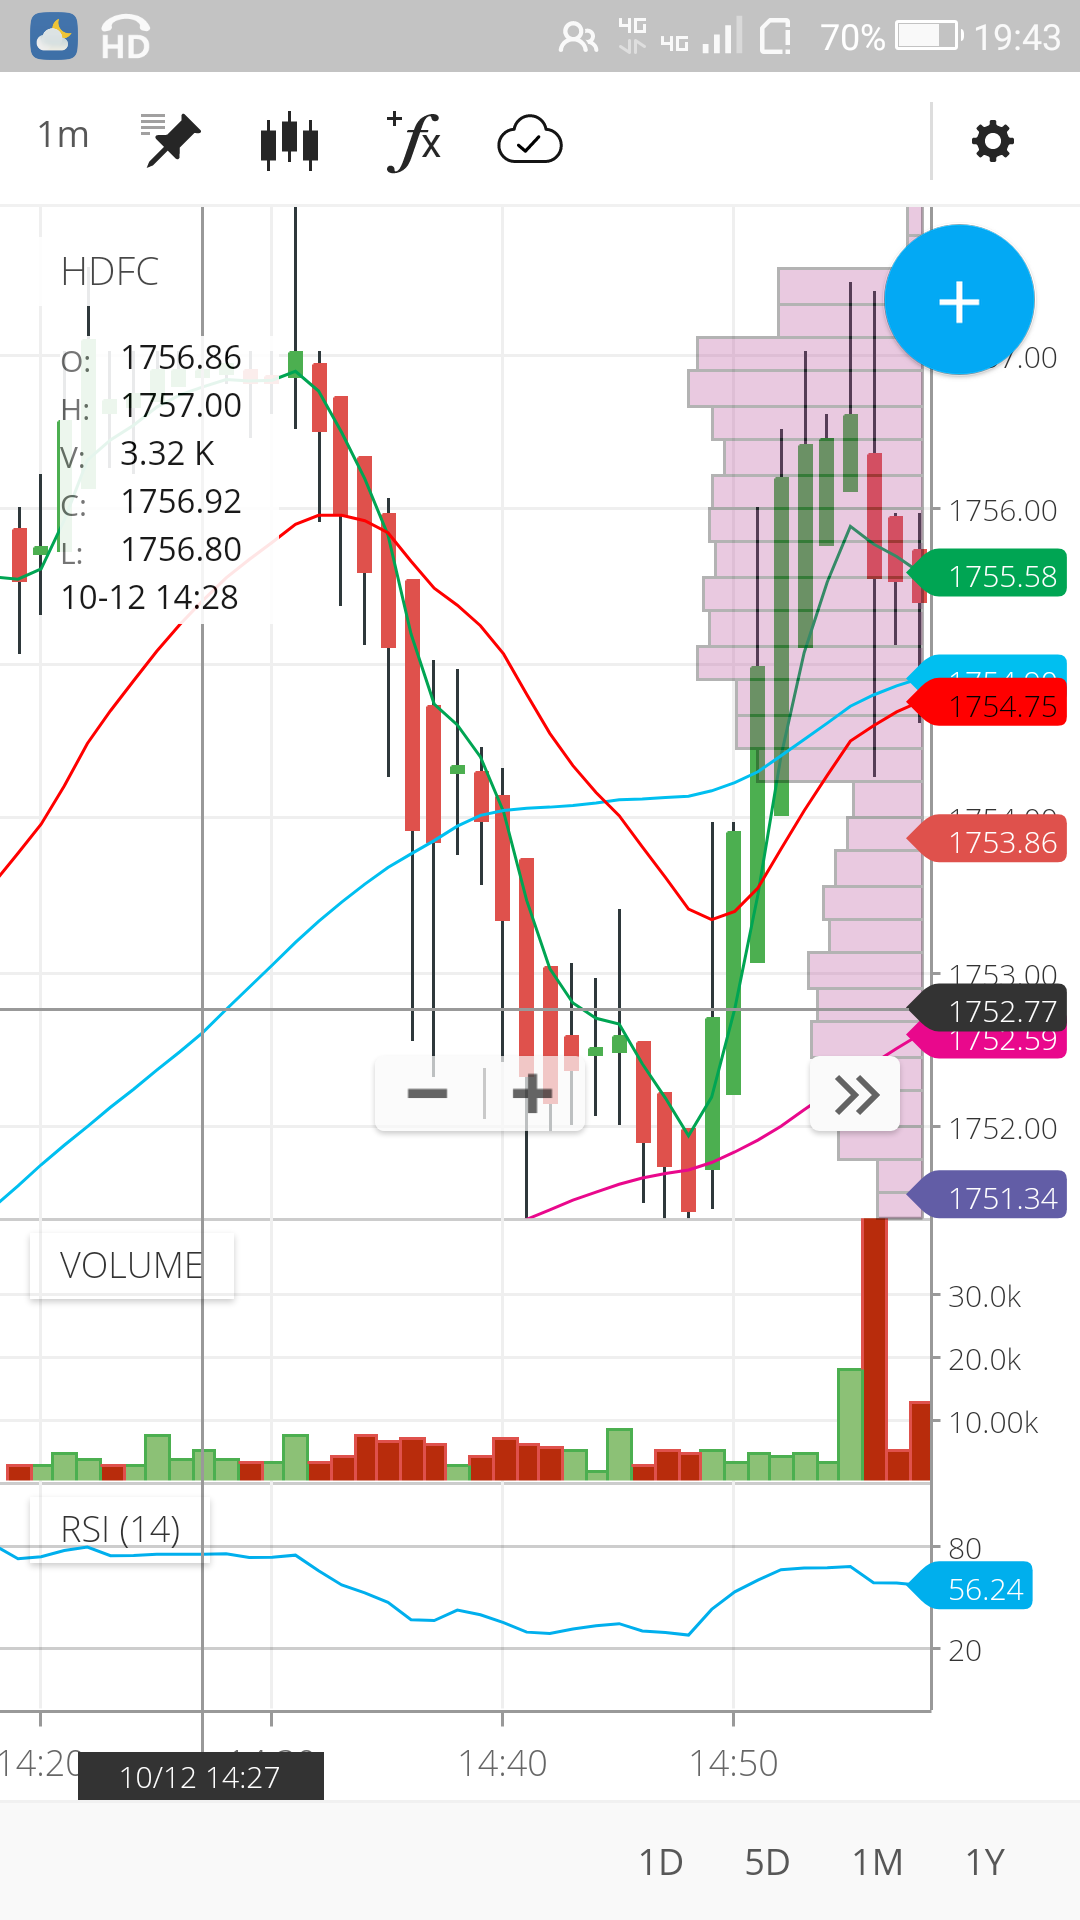
any one trading on 1 min time frame
2 Likes
No sane experienced trader would trade on 1 min chart. Too much chaos.
If one is hell bent on using 1 min…
Do one thing…
Enter trade using 10 or 15 min chart (as they give late entry) and you can exit using 1 min chart + 10/15 min chart (early exit hence less loss and less profit)
2 Likes
EMA exponential moving average
There are hundreds of Scalpers who trade in 1 Min Chart only.
Time frame depends on your trade holding period.
If you exit in few minutes then 1Min is used.
If you follow trend higher time frames used. Again it depends on how much is your stop loss and trailing stop etc.
Position holding time decides which Time Frame to be used
2 Likes
But profits almost remain same…
With 1 min traders paying higher taxes etc.
1 Like
But profits almost remain same…
With 1 min traders paying higher taxes etc.
1 Like
it is good idea to tradr on 1 min time frame with high period ema like 50 ema and 100 and 200 ema
1 Like
Back test yourself
1 Like
I would Not suggest anyone To Trade on 1 Min Time Frame Until you are A big Scalper (a person who resells shares at a large or quick profit )
1 Like
See 1Min chart with Heiken Ashi Chart to know how Scalpers do trading.
1 Like


Look at this Chart. Go long if two candles make green and exit at the earliest for 0.25% profit
Same for Short with Red candles
4 Likes
Wud just like to sharpen haribabu’s view
First u check in time frame which is atleast 4 to 5 times higher than current eg in his screenshot he has chosen 1 min
So see d trend in 5 mins tf which will b primary trend
Then act as per primary trend in ur action timeframe I.e 1 min in above case…
Summarise candles in heiken ashi mode
5 mins green – 1 min 2 greens one abv other … Buy
5 mins green – 1 min 2 red… exit or wait
5 mins red – 1 min 2 red one below other… Short
5 mins red – 1 min 2 green… exit or wait
Never go against main trend… Use 5 ema for added confirmation if reqd… Else keep it very simple
All d best 
10 Likes
How is Stochastics graph?
Which is the best trading indicator according to your trading experience which helps you gain daily. ?
VWAP for intraday trend analysis, RSI for overbought/oversold regions, ema crossover/reversal patterns for entry and exit. But do note that you are the greatest indicator for your trades because the above indicators are only facilitators for your trade while you are the indicator that determines how much quantity to trade, your monetary target for the day and also when to stop.