Zerodha Fund House at 18 months, and what’s ahead

It will work, until it doesn’t. :sweat:

Our brains are pathetic at accurately judging probabilities, especially at the extremes.

Hopefully, one would have compared the expected-value of
the various investments with varying risks and rates-of-return,
and invested accordingly.

As an example, consider these 2 schemes…

  • an investment scheme A
    • a ~1% chance of losing the entire capital
    • providing 9% returns.
  • an investment scheme B
    • a ~5% chance of losing the entire capital
    • providing 14% returns.

…whose expected-value is the same.

Even armed with such a calculated approach,
there still remains some uncertainty/risk.
as one cannot accurately calculate/predict the probability of success/failure of most investments. :sweat_smile:

1 Like

Hello @cvs, i may not be well-versed in understanding the fundamentals of companies but I did run some calculations on this. I acknowledge your concerns about potential misjudgment in probability however my strategy is “to some extent” grounded in conservative math modeling and empirical data. I had performed some calculations beforehand which I will reference to provide a few quick calculations.

(though all approximate closeby numbers!)

the superiority of top-tier nbfc fds (like bajaj finance offering 8.5% pre-tax) over alternatives like LIQUIDCASE (say approx. 6.5% pre-tax) is demonstrable through risk-adjusted post-tax returns. For an investor in the 30% tax bracket the FDs post-tax return is 8.5% × (1−0.3) = 5.95%. The ETFs post-tax return is 6.52% × (1−0.3) = 4.56%. Incorporating a deliberately conservative annual collapse risk of 0.1% for the FD its expected value is calculated as (1−0.001) × (1+0.0595) = 1.0584 yielding a 5.84% risk-adjusted return. This outperforms the ETF’s 4.56% by like close to 128 basis points. For the FD to underperform the ETF, its collapse probability would need to exceed 1.32% (solved (1−p) × 1.0595 = 1.0456 where p = 1 − (1.0456) / (1.0595) = approx. 0.0132), a rate seen 39 times higher than historical norms.

my 0.1% annual collapse assumption is rigorously conservative. Moody’s reports a 0.34% cumulative 10-year default rate for AAA rated corps. Annualized this is 1 − (1 − 0.0034 ) ^ 0.1 = 0.00034 or 0.034% per year. My 0.1% estimate is thus way above historical data (computed as 0.001/0.00034 ​≈2.94), intentionally buffering for tail risks. This is further justified by Bajaj Finance’s systemic safeguards: CRISIL AAA rating (implying a 0.01% annual default probability), a 3.2 L crore market cap and RBI’s “too big to fail” designation.

now to your hypothetical comparison of two investment schemes with identical expected values (scheme A 9% return with 1% collapse risk vs scheme B- 14% return with 5% collapse risk both yielding EV approx 1.083) misrepresents my strategy because it conflates fundamentally different risk categories. Like I said, I exclusively select AAA rated FDs like Bajaj Finance which occupy a distinct low-risk universe where such high risk alternatives are irrelevant.

My AAA FD: Post-tax return (30% bracket): 8.5% × (1−0.3) = 5.95%. With conservative 0.1% annual collapse risk: EVFD = (1−0.001) × (1+0.0595) = 1.0584 (5.84% risk-adjusted return)

Your Scheme B (high-risk FD example): Post-tax return: 14% × (1−0.3) = 9.8%. With 5% collapse risk: EVHigh-Risk = (1−0.05) × (1+0.098) = 1.0431 (4.31% risk-adjusted return)

Comparison: EVFD − EVHigh-Risk = 1.0584−1.0431 = 0.0153 (153 basis points higher), again lowest approx.

The 5% collapse risk in Scheme B is 50× higher than my AAA FD’s risk (0.1%) making them non-comparable. I categorically reject Scheme b-type instruments! My portfolio only includes institutions with CRISIL AAA ratings (historical default probability: 0.034%/year) ensuring collapse probabilities never approach 5%.

to conclude, your equal-EV construct ignores that true optimization requires dominating all lower-risk alternatives actually which my strategy achieves. The AAA FD’s EV (5.84%) surpasses both high-risk FDs (4.31%) and liquid ETFs (4.56%), rendering the hypothetical irrelevant to my approach.

In essence, some math does confirm that large nbfc fds provide statistically robust and materially superior post-tax returns versus liquid ETFs for non-traders (ignore everything if you need collateral). This is to some extent disciplined optimization and not probability misjudgment.

That’s enough forums for today! :slightly_smiling_face:

1 Like

If only you had written all these assumptions and formula in your original post I would have not put my two cents in replying…

Fell for the " I go with a silly approach for my…I am very poor at it " etc.

Deleting my silly reply to your post. … what a waste of my time lilly penne. (lilly girl in malayalam)

2 Likes

Thank you @livepositionaltrader for sharing the detailed thought-process behind the NBFC-FD approach.

The previous post was underselling the amount of careful thought
that has gone into the investment approach into NBFC-FDs. :slight_smile:

Subsequently with all the details involved, being discussed in this topic-thread,
hopefully now anyone else reading this topic-thread in future,
will not go for any abstract approach to calculating risk based on their “gut-feel” of a brand. :sweat_smile:


Also, here are a couple of potentially overlooked aspects in the “NBFC-FD” approach described so far.
( Sharing just in case these were not considered yet.
In case these aspects were already considered,
please do elaborate if you arrived at a different conclusion than the following. )

1. Comparing returns from NBFC FDs to LIQUIDCASE ignores their differences in liquidity.

What was the lock-in period of the NBFC-FDs offering the 7-8% annual rate of return?

For example, if we are considering NBFC-FDs that mature over 18-60months,
then the appropriate benchmarks to compare them against would be
T-BILLs, GSECs, SDLs, maturing over a similar time-horizon.

These assets offer higher returns than LIQUIDCASE,
- due to the lower liquidity
and higher expected value than NBFC FDs
- due to the further drop in probability of default (Sovereign vs. CRISIL-AAA).

2. The methodology behind the default-rate implied by a CRISIL-AAA rating is unclear.

Could you please share any references that led to the following assertions?
i would like to understand the methodology behind the same.

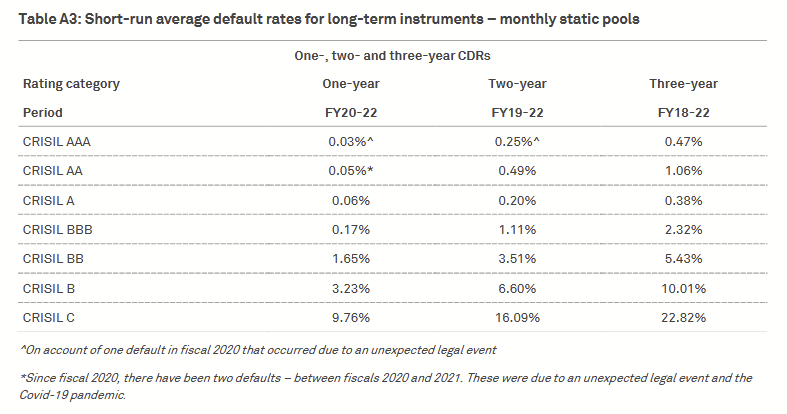
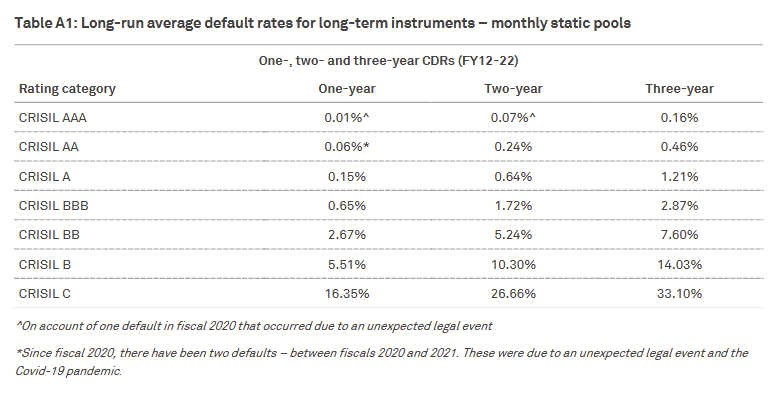
As an additional data-point, looking at CRISIL’s own report from 2022-23
(that popped-up in an online-search for CRISIL ratings and their associated default-rates)
which mentions that over a 10-year analysis period,
the cumulative default rates are significantly higher than 0.1% over a 2-3 year horizon
(the periods over which NBFC-FDs are offering the high 7-8% returns being discussed)

...and even higher default-rates during the recent relatively more volatile years.


[ Source ]

Rate of returns of an NBFC-FD over various tenures
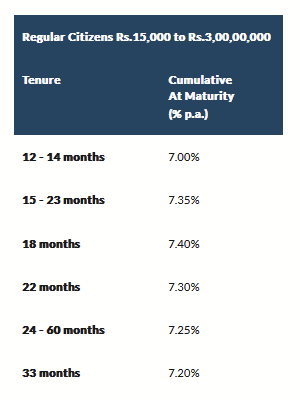
image
[ Source ]

If we consider the range of default-rates from the above CRISIL report,
i.e. 0.07%, 0.16%, …, as high as 0.47% in recent times,

EVFD = (1 - 0.0007) × (1 + 0.0595) = 1.05876 (~5.88% risk-adjusted return)
...
...
EVFD = (1 - 0.0047) × (1 + 0.0595) = 1.05452 (~5.45% risk-adjusted return)

Note: The above math is overt nitpicking. The margin-of-error around these numbers is higher than what the above precision implies. The point being that, at extremes, even tiny numbers make a outsized difference.

PS: A previous draft of this post contained an error in calculations, despite my best efforts to triple-check it before posting. This has only further solidified my belief that the human brain cannot intuit accurately at extremes. :sweat: Please do highlight if any other errors, either logical or mathematical, have still slipped through.


A 3rd overlooked aspect. (potentially off-topic if each investment is evaluated in isolation)

3. The entire capital invested in an NBFC-FD is at the designated risk

(…however minuscule the risk may be.)

If investing in such instruments to maximize returns, while…

  • …lowering overall risk
  • …ensuring predictable-income / future-assets

…then the barbell approach can be of relevance in this context/scenario.

Attempting to extract a few additional points of return
by investing in a “middle-of-the-road” somewhat riskier proposition
is usually worse than explicitly splitting one’s investments into 2, and,

  • ,continue investing the fraction that one cannot afford to lose.
    • at zero risk (as near zero in reality as possible).
  • ,investing the fraction that one can afford to lose.
    • at a significantly higher-risk (as high as one wishes/expects overall returns to be)

PPS: This barbell approach is also applicable outside of purely financial scenarios.

1 Like

Tagging @VishalJain and @Bhuvan here.

1 Like

Noted. The industry is still waiting for some regulatory clarity on hybrid passive. Once that happens we will be able move ahead with a product. Thanks

1 Like

@neha1101 first off lilly penne :smile: — your instinct to prioritize banks might actually be smarter (many ideas underneath) than chasing some stupid math. like beyond percentages and credit ratings, theres a critical layer we often ignore real-world usability.

no spreadsheet captures the sheer agony of dealing with apps that turn investing into warfare. i have battled platforms like union bank and shriram finance where funds were deducted without even opening the fd leaving me chasing customer support for weeks, armed with screenshots as “proof.” that promised 10%+ return (even if they eventually deliver it whatever) means nothing when your money is stuck in limbo and you are begging for a resolution. contrast that with federal banks app experience. even at half the rate its 99% success rate (in my personal exp) and 0 headaches makse it worth. sometimes, things like branch proximity or reliable apps matter more than squeezing out an extra few percentage points from a broken system. like at the end of the day, peace of mind often trumps percentages.

3 Likes

It is a trade-off right, we are trading our peace of mind for the premium (additional return), although we don’t see it that way because we see the chances of a default as being remote.

The risk premium (excess return over risk-free rate) is paid to compensate for all sorts of uncertainty, be it liquidity risk or default risk etc…

The risk premium in essence is anxiety premium. (Compensation for the sigh of relief you breathe when you finally get the promised return and your capital back)

If our bets are successful, we get the premium, if not, we are left with anxiety.

1 Like

why not just invest in medium and long duration g-sec via ETFs? why worry investing 5L in each bank and having to worry that the bank may get into some issue? I am still confused.

Congratulations to Zerodha

5 L is the amount that is protected by Insurance. When you open an account, with a Bank, I do not think this is even a factor to consider for PSU banks and large private banks. Yes this may be a factor if you go in for small banks then this should be consdiered. I am talking about PSU and listed banks and not co -op or regional banks.

Banks are considered safe and well regulated. Now people will say examples of Indus Ind bank and Yes bank etc. But look at the aftermath, RBI came out with a message that Indus Ind bank is well capitalised and Yes bank was saved by SBI and clutch of other private banks. This is the strenght of being a bank. This is the reason, why if you start a company, you cannot use the word Bank in your title. (As it will confuse general public that this is a bank and people may trust it the same way they trust bank)

The trust level that people have on banks cannot be underestimated.

It is only in this forum, I have come across people who normally are traders who undertake high risk transactions, where the entire capital can be lost or gained, suddenly becomes Chief Risk Officer when it comes to banks, the talk goes on to risk mitigants, banks failures, insurance only 5 L and the worst is Tax deducted. See your comments as well …“.having to worry that the bank may get into some issues”…really you worry about this.

You can invest in g-sec as it has sovereign guarantee, no question about that, but you need to pay commission when you buy and sell not sure if zerodha charges but other brokers does and the risk of liquidity when it comes to a ETF. Banks are better when it comes to this aspect.

If the returns from Gsec via ETF gives u a higher return than bank deposits, yes go ahead with this but this does not mean Banks are bad. In fact when the gsec was originally issued and people subscribed, all the money that the issuer got (Govt) was deposited in a BANK…

1 Like

To me, Its painful to keep track all your Bank Accounts / FDs in each bank rather looking at the ETF. May be its different for others. Didn’t mean to offend you in any means.

You know it wouldn’t cost much to sell ETFs (holding med / long term g-sec) after profits on a stock broker like for example, Zerodha. For short / medium term these are not a good debt holdings, though one can argue about last year returns.

I am curious, why not Zerodha and why ICICIDirect? I have the ICICIDirect too and i have never used it after i moved to Zerodha.

1 Like

I am a fan of FD hence gets into overdrive.

Been with them since 2007, never thought of moving out.