Hi Jason, this appears to be a one-off case. While we will be recomputing the curve sometime next week, we kindly request you to raise a ticket here so we can investigate the cause.
No. It is not. I have 6 accounts and all the accounts have same problem. I am sure others are facing similar issues.
Let us check and get back on this.
One of my friends has similar issue. His nav dips huge on 31st Dec and then comes back. And nothing as such changed in his account that would have justified this.
This also happened to me. I raised a ticket and got it fixed. He never raised and it’s not fixed. Now I will just wait and see what is the maximum period that stuff like this can remain unfixed. I guess the answer is something like “infinity” but let’s see.
I also suggest you to not raise the ticket from all six accounts. Skip one account. Just see what is going on here.
I haven’t raised even 1.
A very gentle reminder. ![]()
We’ll be running a recalculation for everyone. This will be resolved then. We’ll surely keep you updated.
@Ruchi_Porwal Why is my Performance Curve having so much spikes recently. The difference between top and bottom is nearly 25-30% over a day. And it’s not a one-offs. My account value hasn’t changed much in these days.
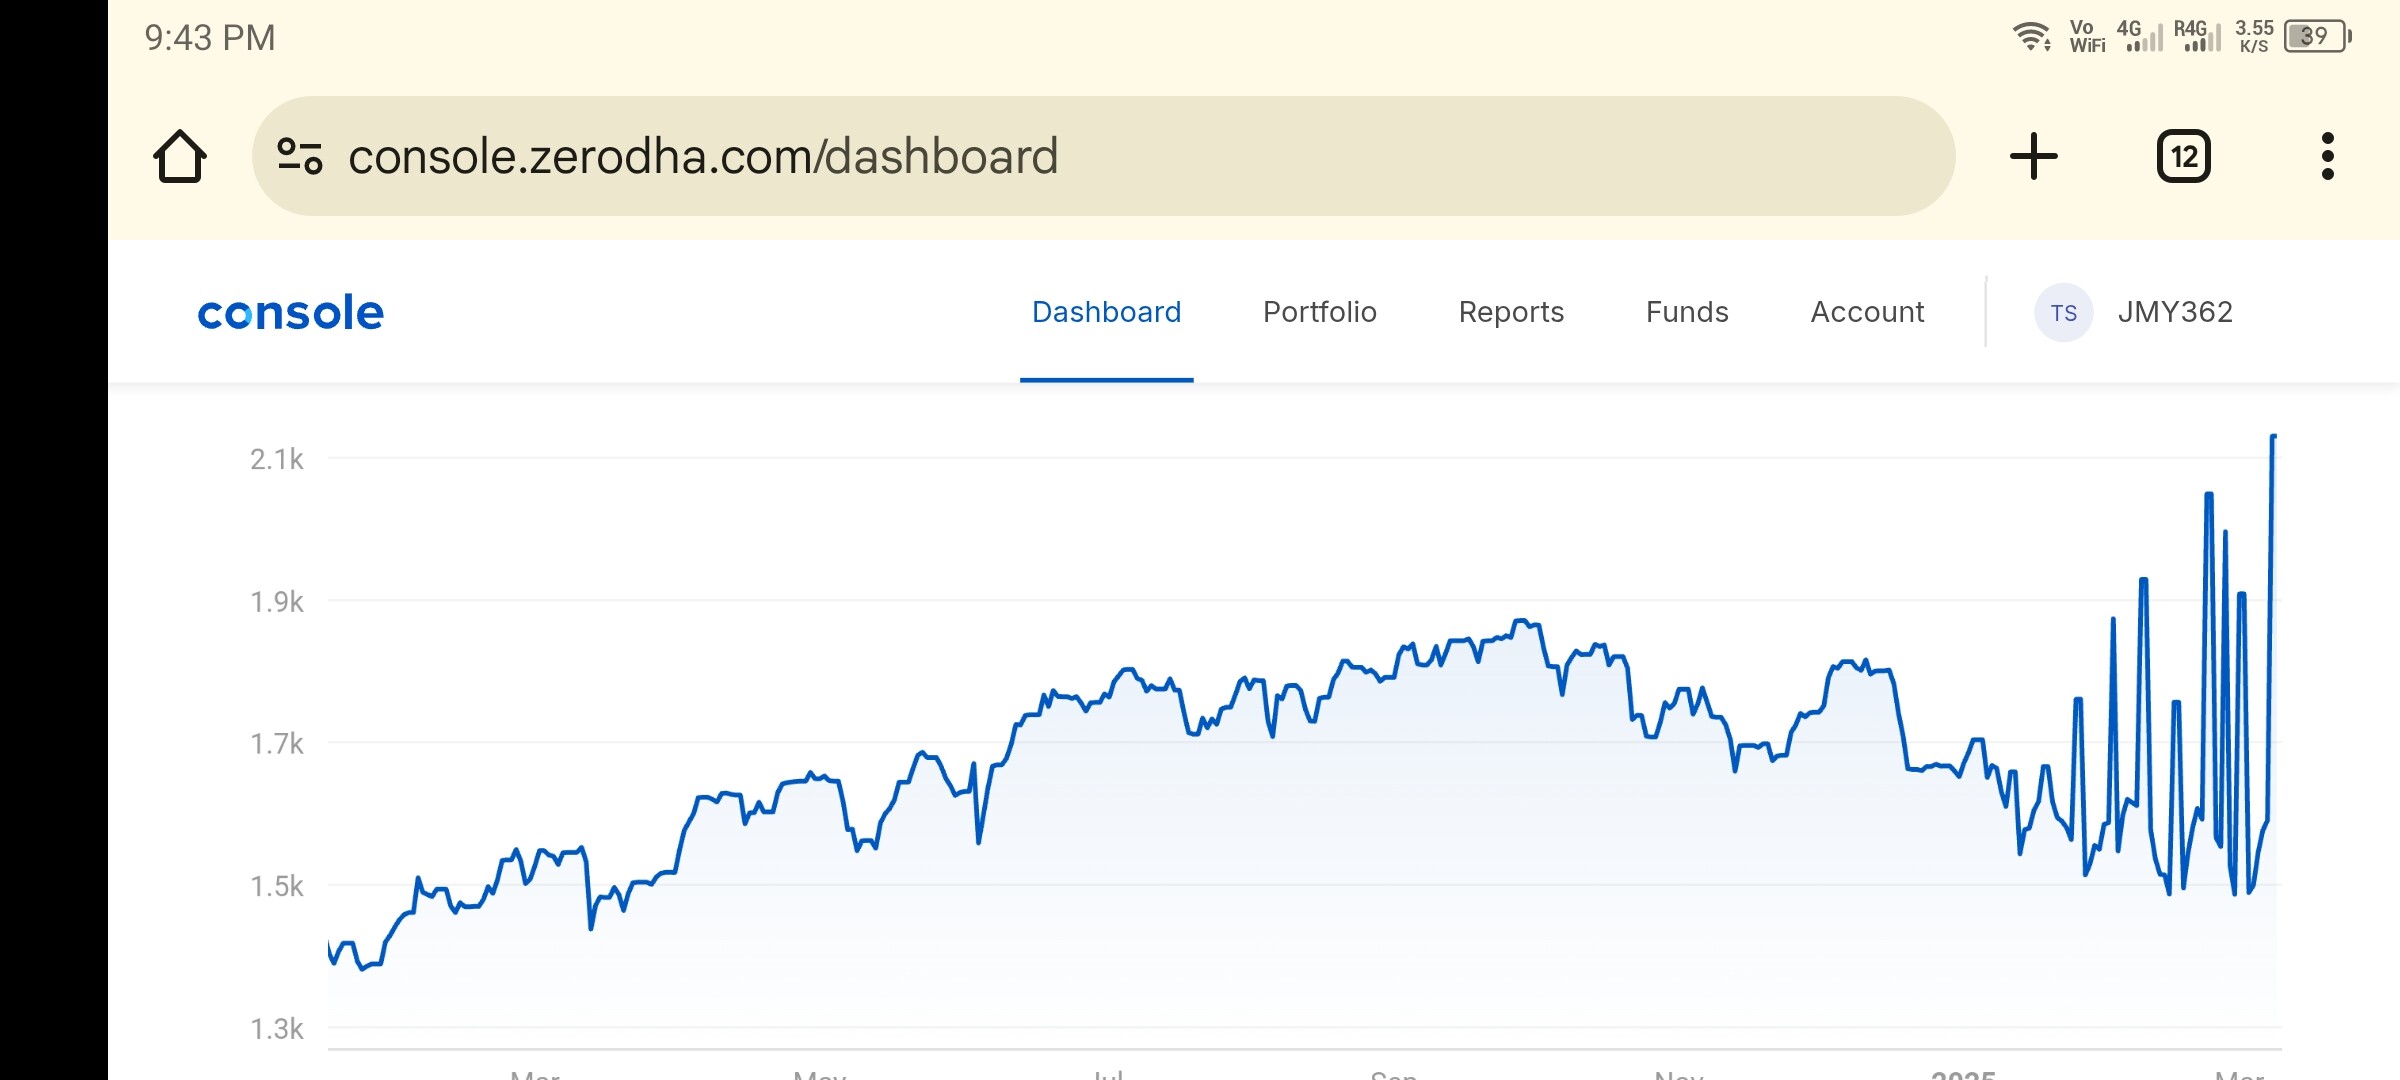
Hey, this is because of MTF positions in your account. This is a known occurrence. A fix is pushed and this will reflect properly in the next version of the curve.
Did you guys implement stock-transfer handling ? I still see the huge jump in the curve.
Not implemented yet
Hi @atanud
We just launched the latest version of the curve that covers most of the case scenarios. However, implementing stock transfer logic turns out to be a little challenging at the moment, but is on our list of improvements for the curve. We’ll update this thread once we have the implementation in place.
So the data is not from 2020 now?
@nithin @nithin_kumrr @TheGouda
It’s great to see Team Z aggressively working on the Console. Recently, I noticed developments in the performance curve. Regarding this, I have a few suggestions. Additionally, on the Console dashboard, it would be helpful to display performance analytics similar to those provided by IBKR (refer to the attached screenshot for reference). I believe Team Z can also build such a feature. This would add significant value for investors and traders by providing deeper insights into risk and performance.


@TheGouda
Equity value and portfolio trends look quite similar. I think the equity value might be including the cash balance, which could be influencing the overall movement. The cash balance should not be included in equity; instead, the portfolio value should be considered as per NAV.
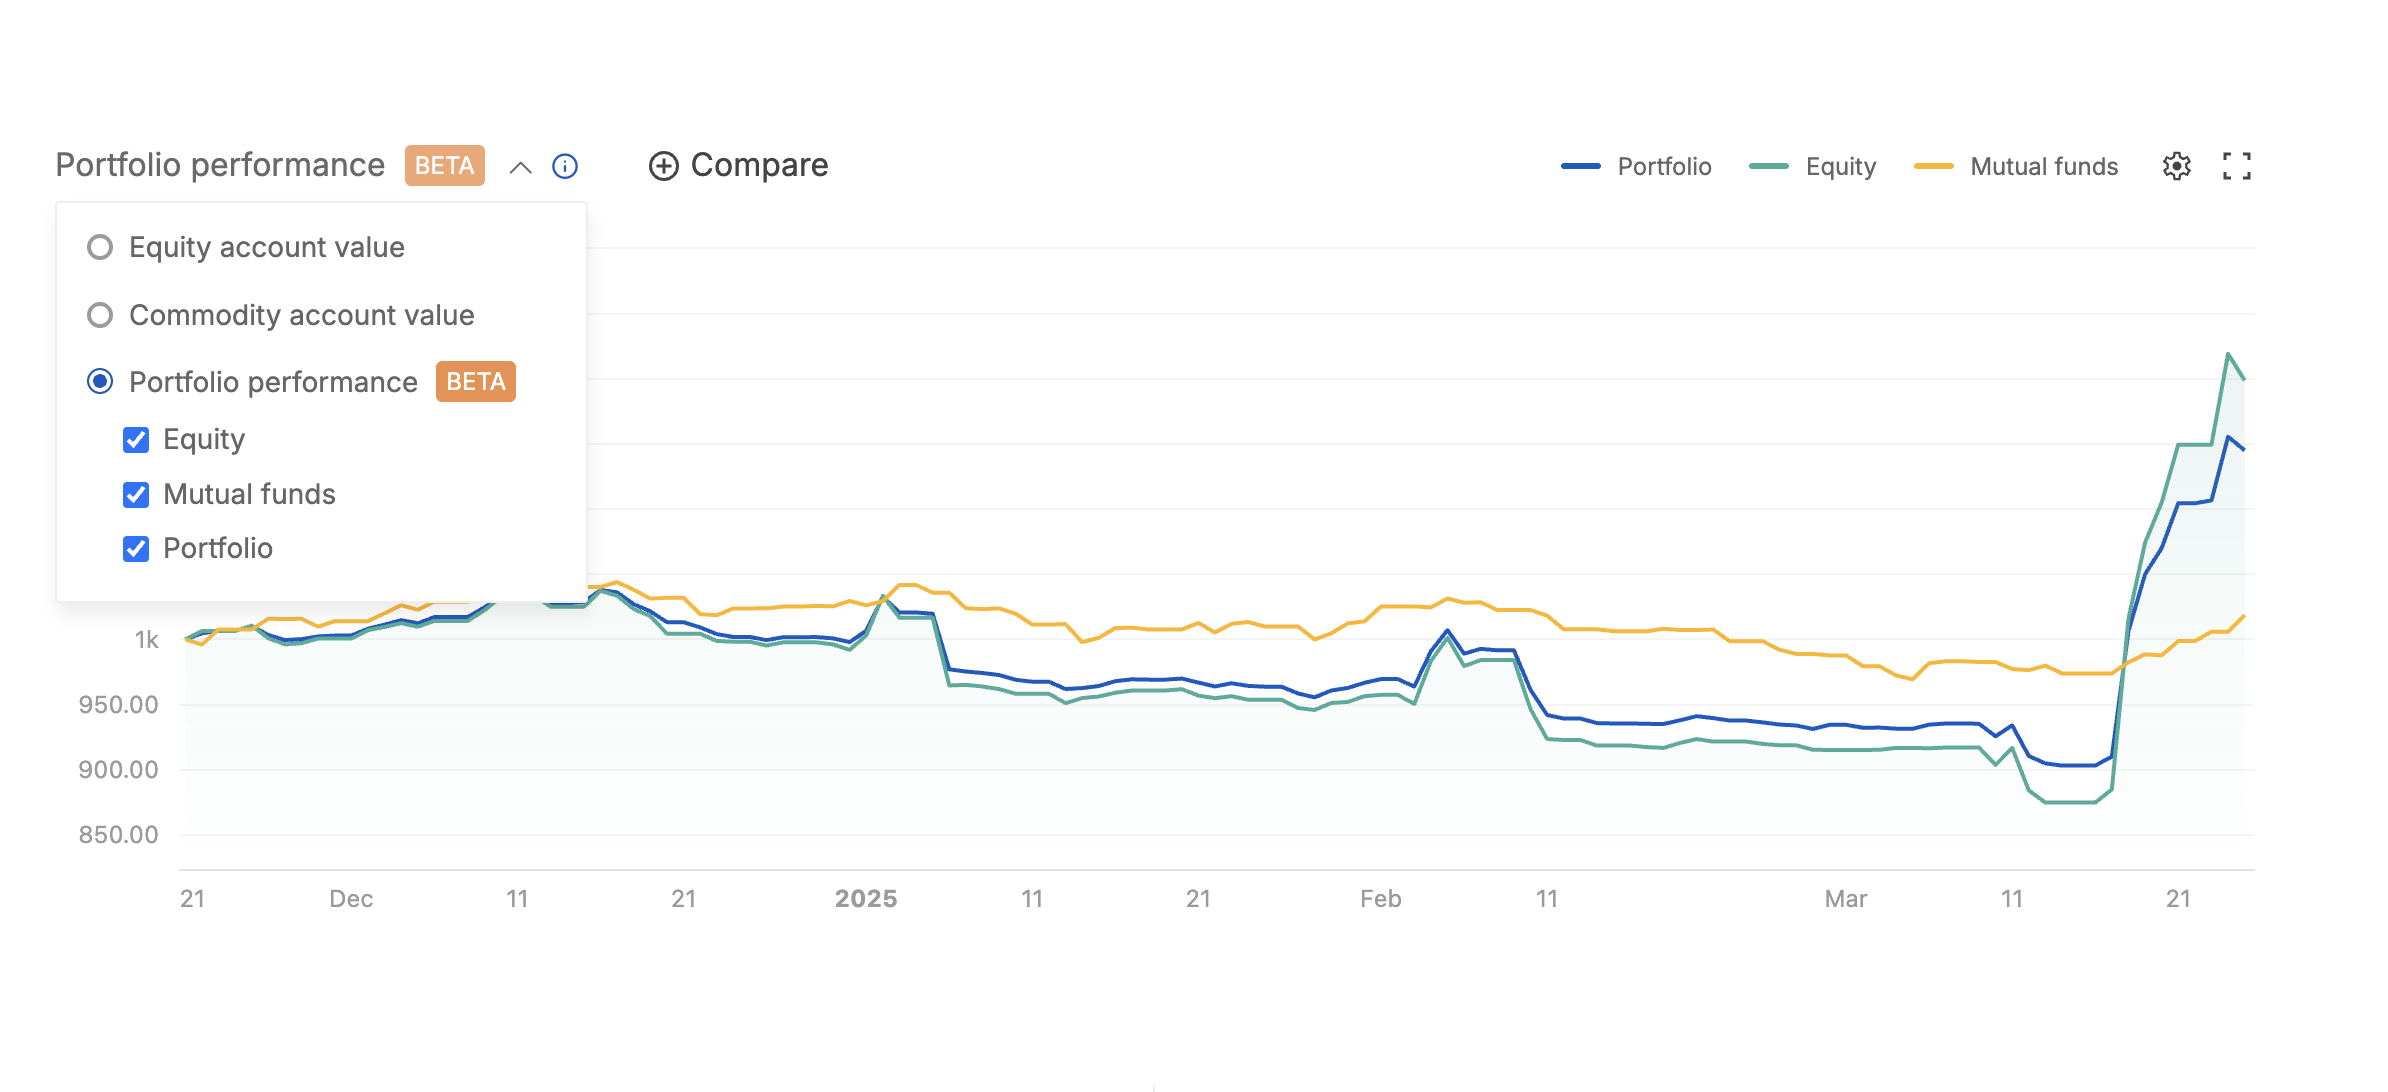
The recent uptrend appears to be due to profits from F&O trading being included in both equity and portfolio values. However, I don’t have any equity holdings except for GOLDCASE ETF, and the mutual fund value is showing correctly.
Yep, on our list of things to do. The most challenging bit was calculating the NAV per day for all the customers.
Ah no
Portfolio = Equity + MF value together.
Yeah, equity value would go up if there is F&O profits.
@nithin Cash should be treated as part of the portfolio rather than equity, as F&O transactions are cash-settled daily. Equity valuation applies only when actual equity holdings exist.
No, the way this is calculated is based on your account value, not just your portfolio value.