Hey, yes, we now have the data for ~3 years i.e. from July 2022. It’s meant to be more accurate and gives a scope to add more analytics.
Can you introduce a feature that we can draw price range graphs to calculate draw-down etc.
Or if we can export the data so that we can do our calculations?
Hey, we plan to add additional features and allow users to export data in the coming weeks. We’ll keep you posted on the developments in this thread
2 Likes
still waiting for datewise P&L statement.
DM’ed you for details.
@Ruchi_Porwal @nithin Thanks for this feature. It is quite useful. Could we also please adjust for any off market transfers like transmission we received after death? This skews the NAV significantly and does not show the data correctly, even though corrective entries are done on the console
Hi @tarun2
Gifting of share transfers has been handled on the curve. However, handling off-market transfers and transmissions was not straightforward. We’ll explore this and try to include it.
Can I know how the Combined NAV is calculated ?
Is the combined NAV, the Weighted average NAV of Equity and MF NAVs ?
I get that Portfolio value = Equity value + MF value
And i believe that, in the performance curve, the Combined NAV refers to the NAV of the Portfolio.
However, unlike portfolio value, Combined NAV is not the sum of equity and MF NAVs
i.e., Combined NAV ≠ Equity NAV + MF NAV
If I only have equity in my portfolio, my combined NAV will be same as the Equity NAV.
But, when I have both MF and equity in my portfolio, how is the combined NAV calculated ?
Hey! The portfolio NAV or combined NAV is created by adding up the data points/values of Equity and MF. So yes, if you have only Equity or only MF, the portfolio NAV will be equal to the Equity or MF NAV.
Please fix CDSL transfers. I have input the buy price and dates after transferring, should not be tough to factor it in the NAV if you consider it as normal market transaction.
The graph is completely messed up due to transfers a year ago.
There should be a way to treat the start date of the graph as 0. So I set the graph to March 25, all NAVs should be normalized and start from 0.
Example:
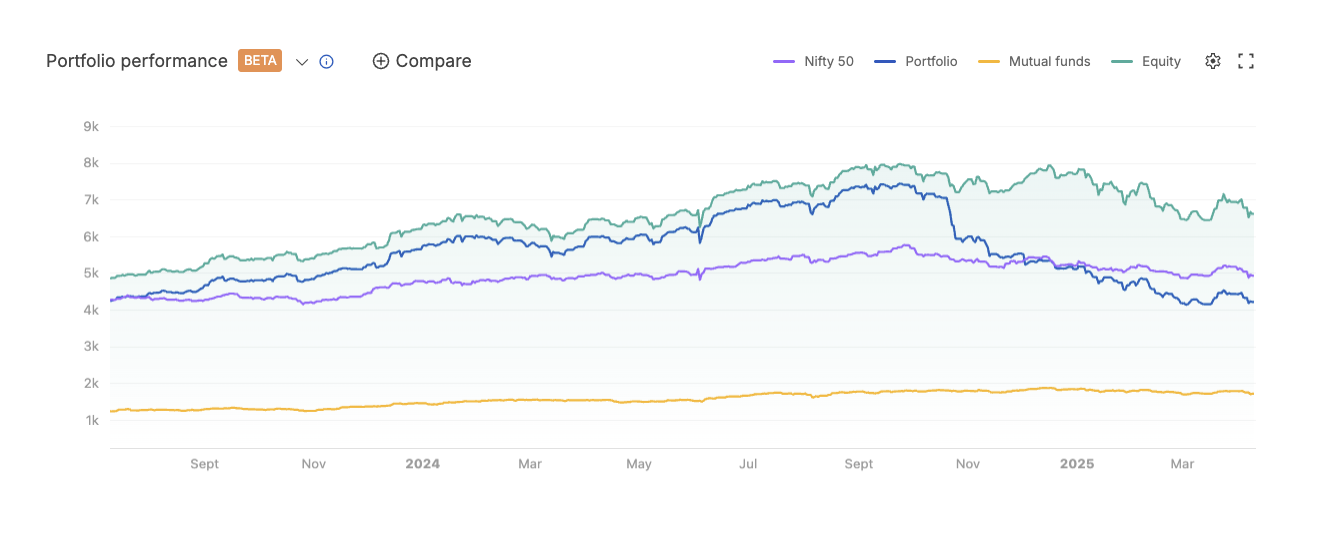
Nifty 50 doubling in the graph, seems like something is wrong in your calculations. If I exclude off market dates from graph, even then this is happening
Nifty 50 values are not a factor of transfer in/out. Let us check this case.
Sorry, but I still didn’t get what this means.
Do you mean
Combined NAV = (Equity NAV + MF NAV)
If the above was true, the combined NAV value and the portfolio curve will always be above the equity and MF curves, but that doesn’t seem to be the case.
From what I see from my performance curve, the Combined NAV is not the sum of Equity NAV and MF NAV, i can’t figure out how its value is arrived.
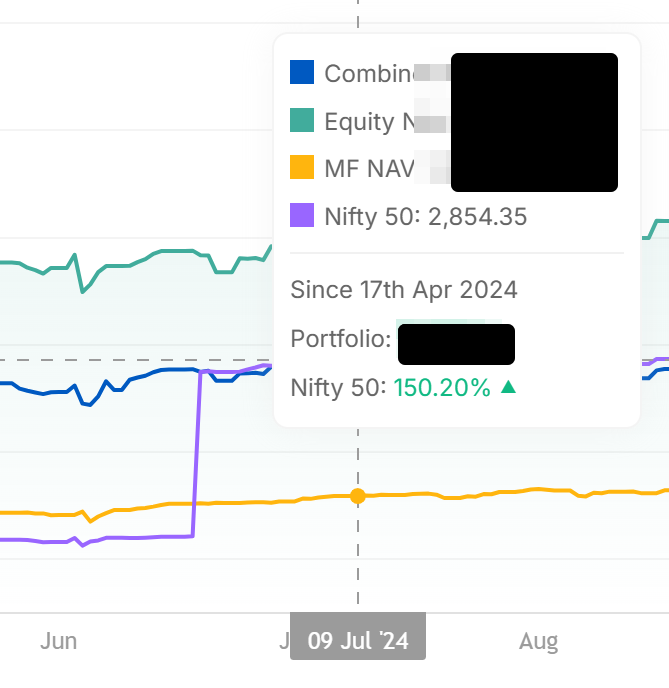
For eg: Between 9th Jan, 2025 and 10th Jan, 2025, The combined NAV in my performance curve seems to have dropped by 24% for no reason, despite there being less than 0.5% change in both the equity and MF NAVs during the same period.
All i did was invest in stocks and MFs on 10th Jan.
PS:
Also is there any way to choose the starting date from which the portfolio gets compared with Nifty.
Everytime i check, a new starting date randomly gets assigned, based on how i zoom in or out.
We don’t do the absolute sum of NAVs because weights matter. We take raw values of MF holdings, EQ holdings, Cash, etc., i.e., all parameters in your account, and plot the “Portfolio” or “Total account” performance curve. Please DM your ID, we’ll check if there’s any issue.
You can zoom in/out and adjust the curve to whatever starting point you want, while it doesn’t normalise to start with 1000. NIFTY will normalise to whatever is the starting point of Portfolio curve on the screen. We’ll see if this experience can be done better.
While using the NAV curve, I found that my combined NAV saw a big drop in recent times, while my equity and Mutual fund didn’t see any drop. What is the reason for this?
Attaching the screenshot below:
Ok. Does that mean we will never have the curve for any period before July 2022? I think the original curve was from 2020 ![]()
Hey @Karthik_Ragu
The curve is built upon several data points and logic. We want to ensure accuracy, which can be difficult while having data from an older time period. But we’ll reconsider this once we implement a few things that are in the pipeline for the current version.
1 Like
Feedback / Additional feature request: @Ruchi_Porwal / @nithin_kumrr / @TheGouda - Please support XIRR calculation for family portfolio as well. It gives different perspective for family holdings.