Have been using it since yesterday and the data is totally on point. So easy to track the markets from one place.
This is so coool @Streak @zerodha
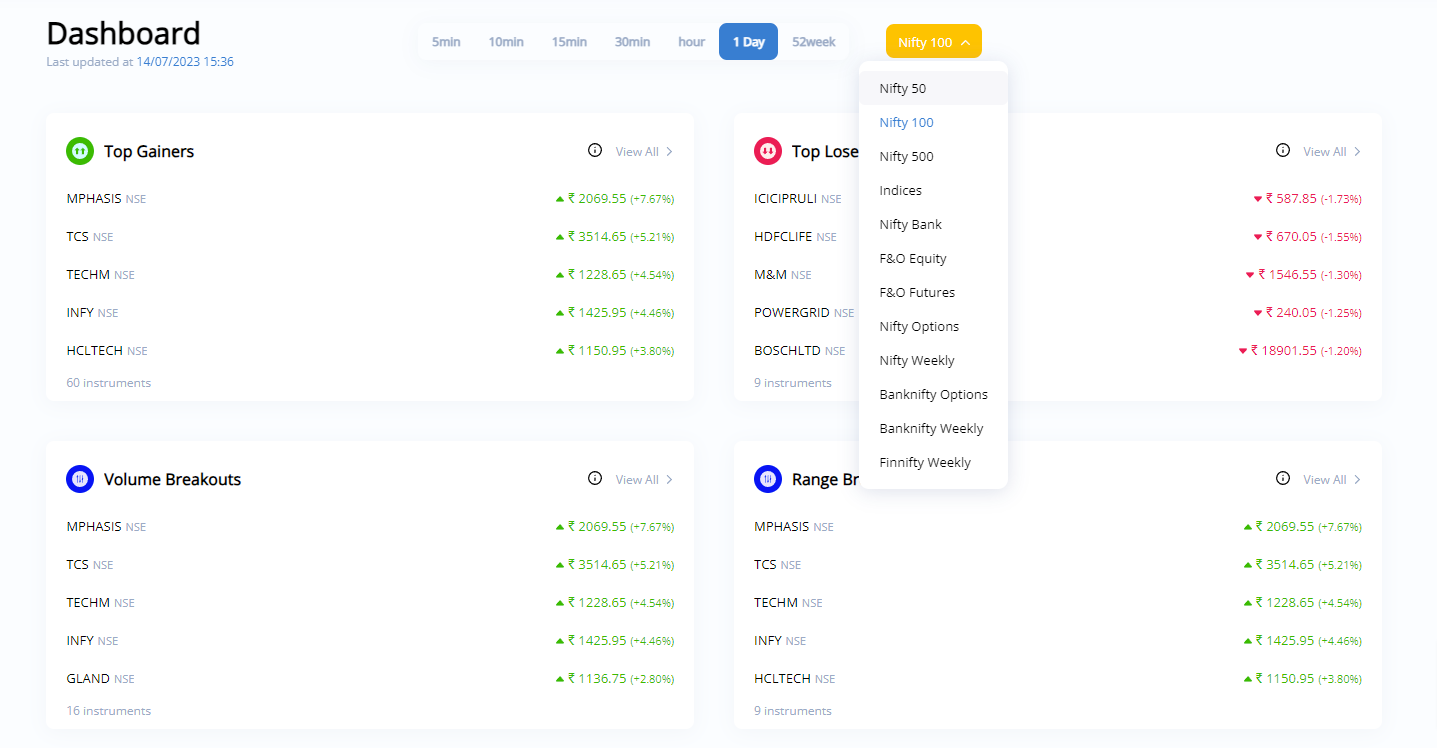
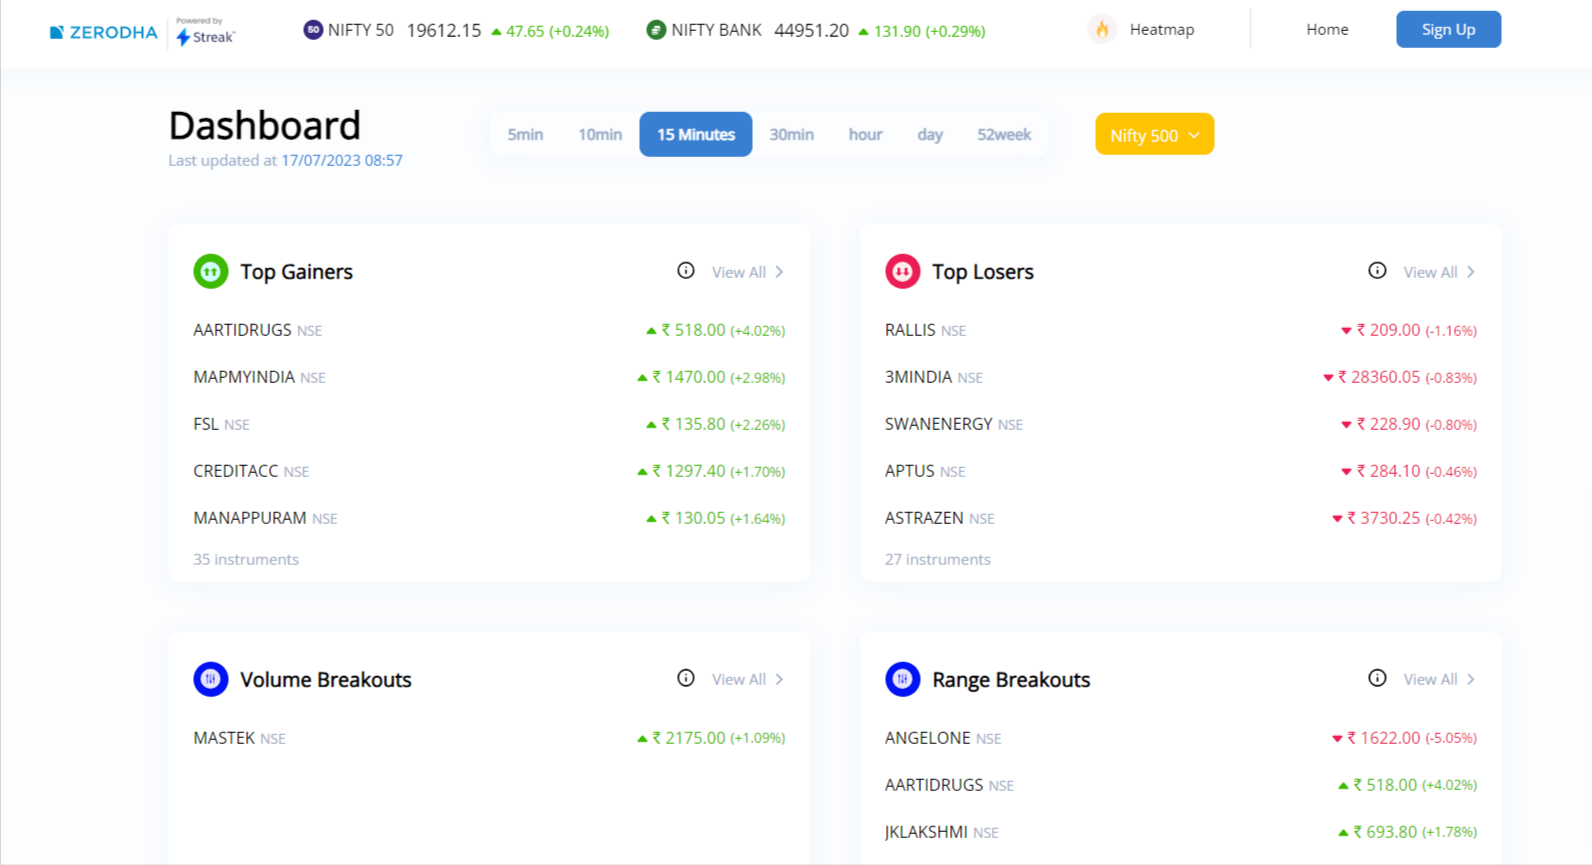
I’m able to access the Top Gainers/Losers and Volume/Range Breakout based on the baskets that I select!! This is so cool.
Already bookmarked it. Working for Option Baskets too… ![]()
Must appreciate the work here ![]()
3 Likes

These scanners are awesome, saving a lot of time as compared to reading charts manually.
Thank you Streak & Zerodha
1 Like
Truly must congratulate the collaborative efforts by both Zerodha and Streak
Providing a website with such concise information and presenting it in a pleasing manner is itself challenging. Kudos !
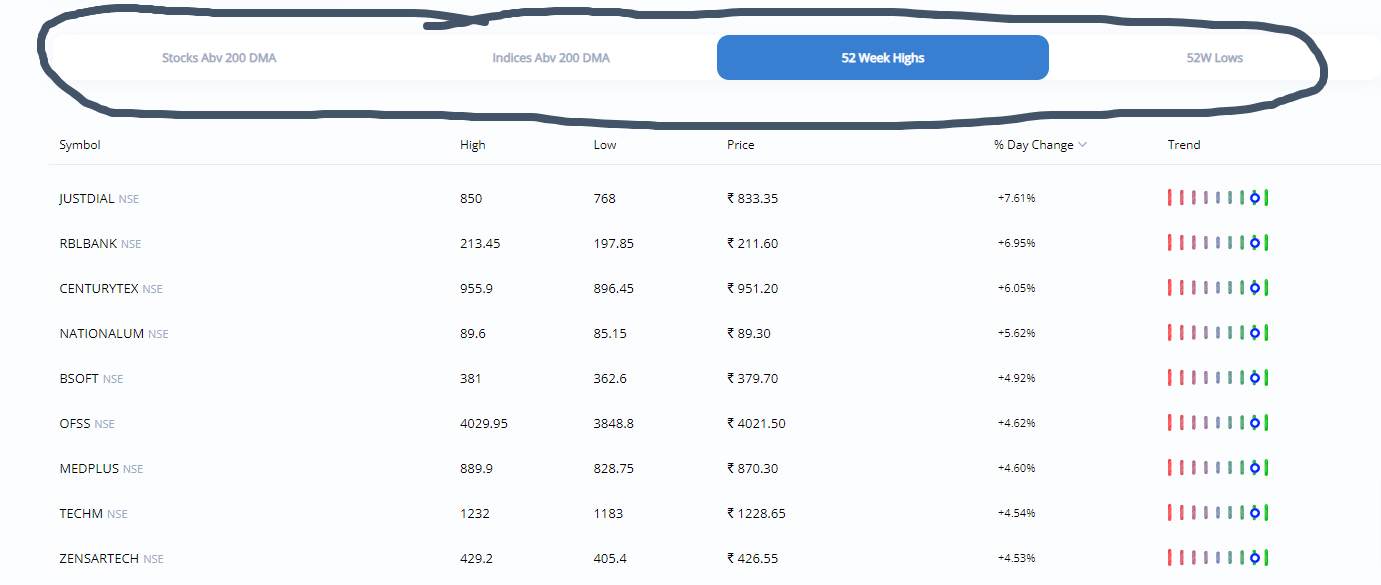
I’m able to see the list of stocks that are at 52 weeks High/ Low, this will truly help spot stocks for long-term investing and is super helpful for naive users.
Nice one! ![]()
3 Likes
Yes.
1 Like
Can we also trade CDS & MCX futures using these scanners?
1 Like

hey shubham, I look for volume breakout in stocks and trade when it falls back or takes support at its 5 EMA on 10 min timeframe
ya nice set of information but I guess exactly this set of data is not available
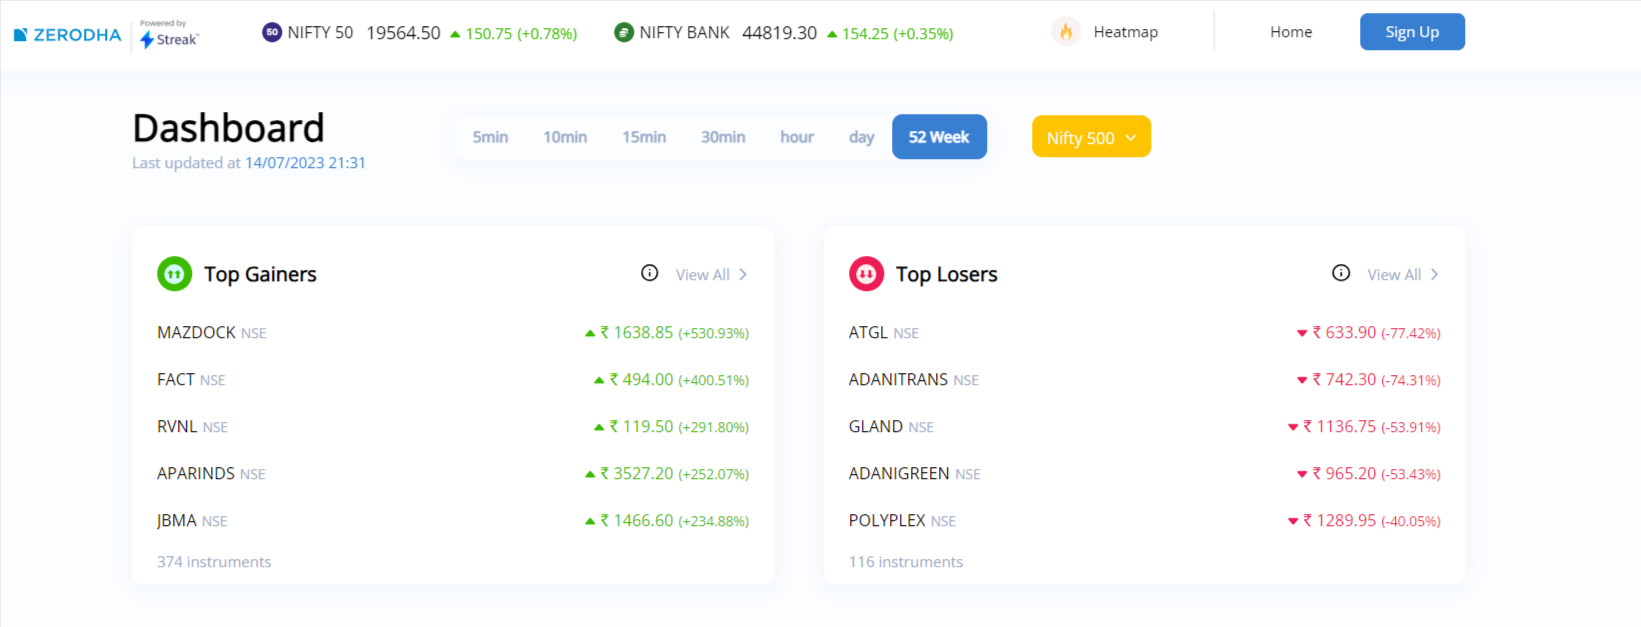
Amazed to see the 52-week Top Gainers and Top Loser data. Crazy amount of returns in the direction of North and South.
Mazdock tops the list with 530% returns will wooden spoon goes to ATGL with 77.42% negative returns.
1 Like
I used to look for Inside candle and other parameters manually on stocks but this feature made it possible to get the results instantly. Enjoying my weekend now with more free time.
Can you share any more of your setups?
I also prefer looking at Volume along with breakouts
How to use this?
I see Justdidal broke 52 week High
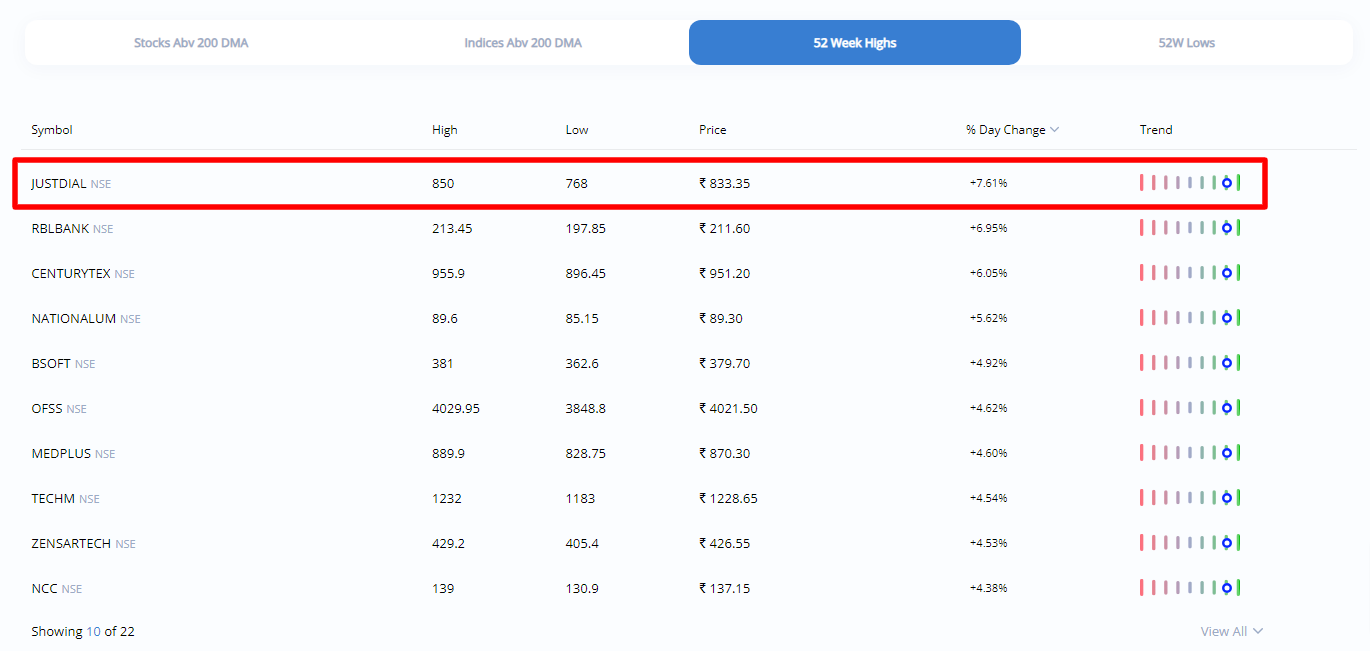
I confirmed in the chart also
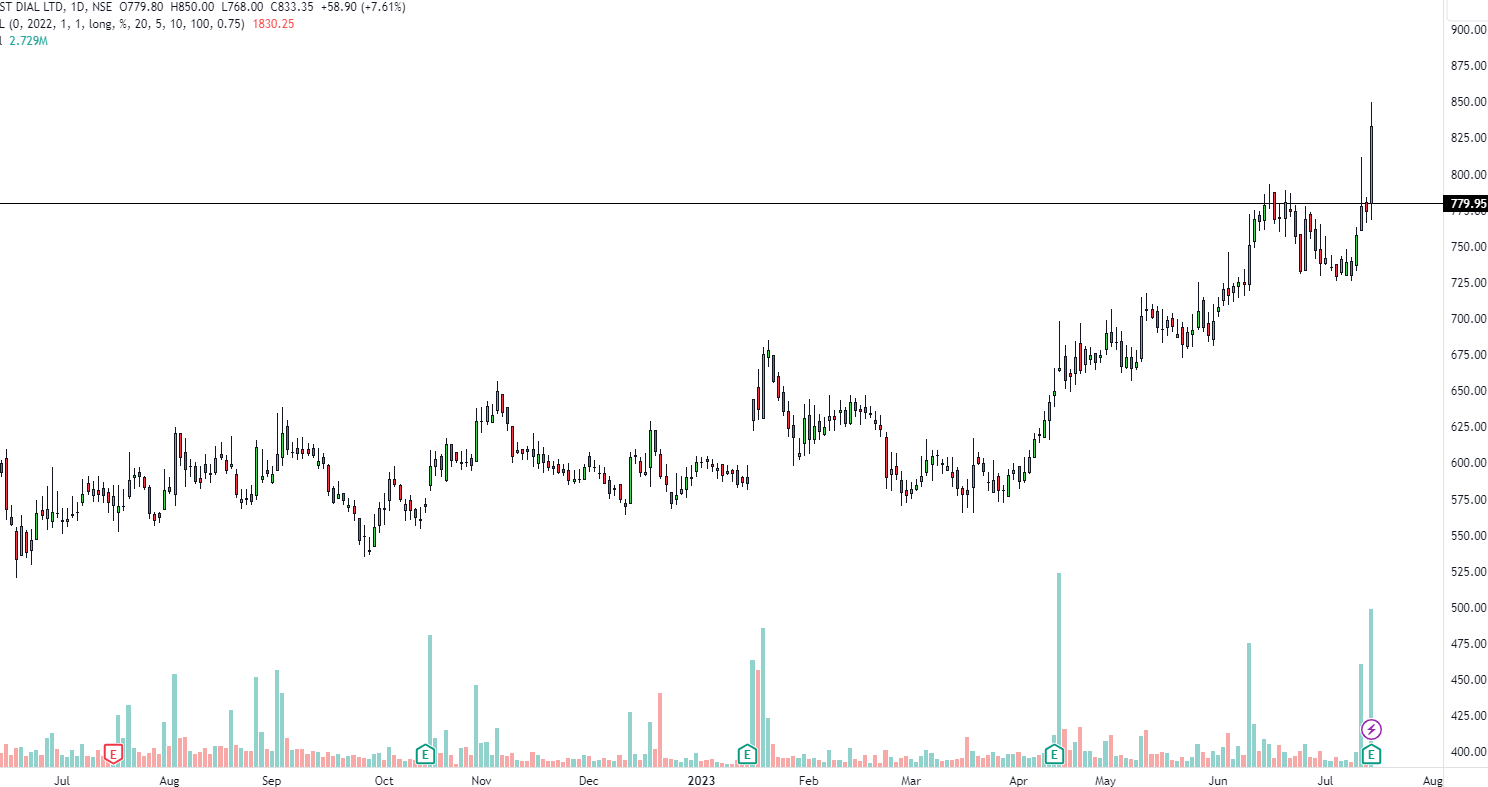
The technicals is showing “bullish”
I am thinking of waiting for a slight retracement, I will buy around 800 levels.
this is a really good suggestion! would be great to see it.
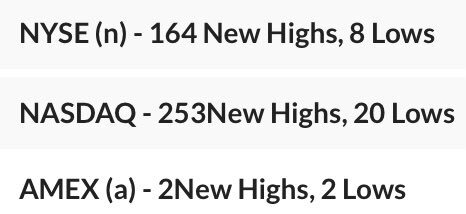
@ShubhS9 i see the historical advance/decline ratio is plotted on a chart and posted on here Weekly trading diary: 17th to 21st July 2023
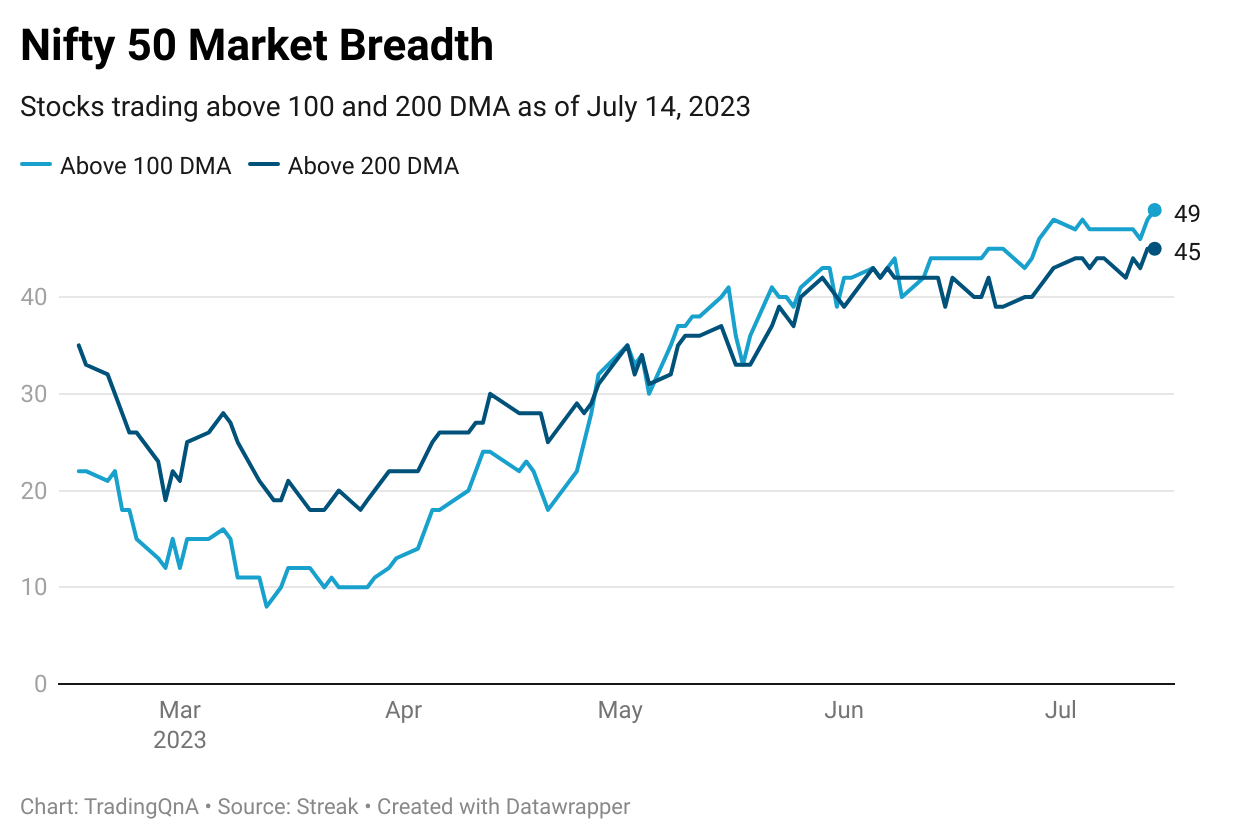
can we all not directly get to see that on http://technicals.zerodha.com/ ?
this will be very helpful and provide great insights while trading
For Traders:
For Investors:
This helps a lot!! ![]()
1 Like
@Praneet_Kumar how do you use it this data?
search for long opportunities on gainers and short opportunities on losers or vise versa? Does this kind of strategy work?