Thanks for the feedback. We’ll look into this.
Hi @CT143,
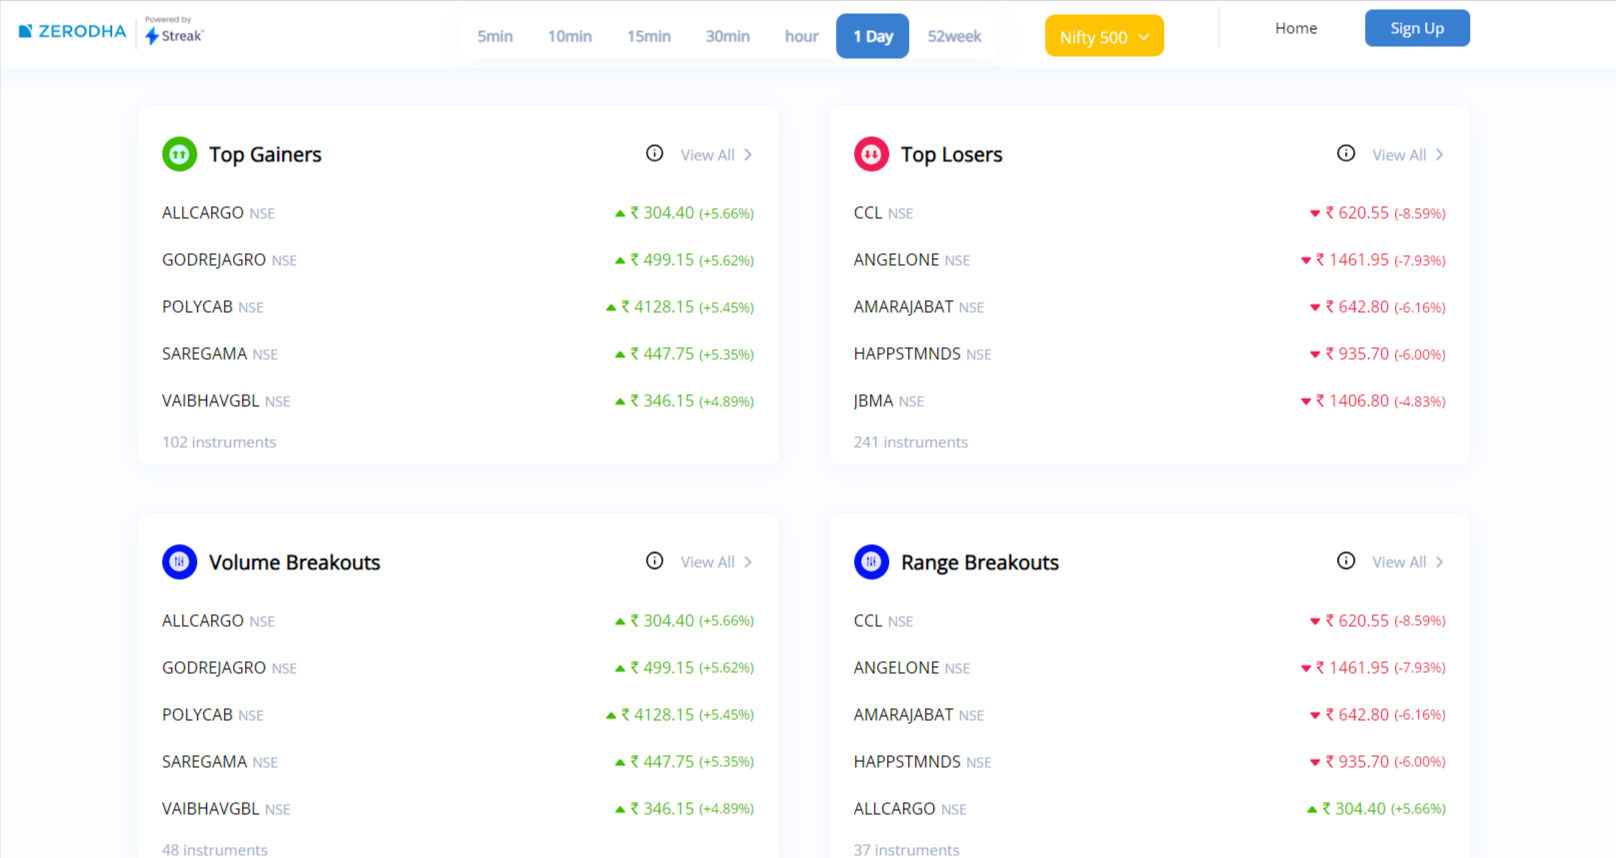
We decided to limit the stock universe to the Nifty 500 to avoid noise from penny stocks. Given the liquidity in stocks beyond Nifty 500 stocks, we didn’t find it prudent to include it here.
If there is a need for it from more users, we can consider including it in the next update.
This looks Great. Nifty and Bank nifty top gainers will be a big help.
But What About Net 52 week New High - Low
That one is a great Market Breadth/gauge Indicator
Used By Many Professional Traders to get a feel about market’s Strength/Weakness.
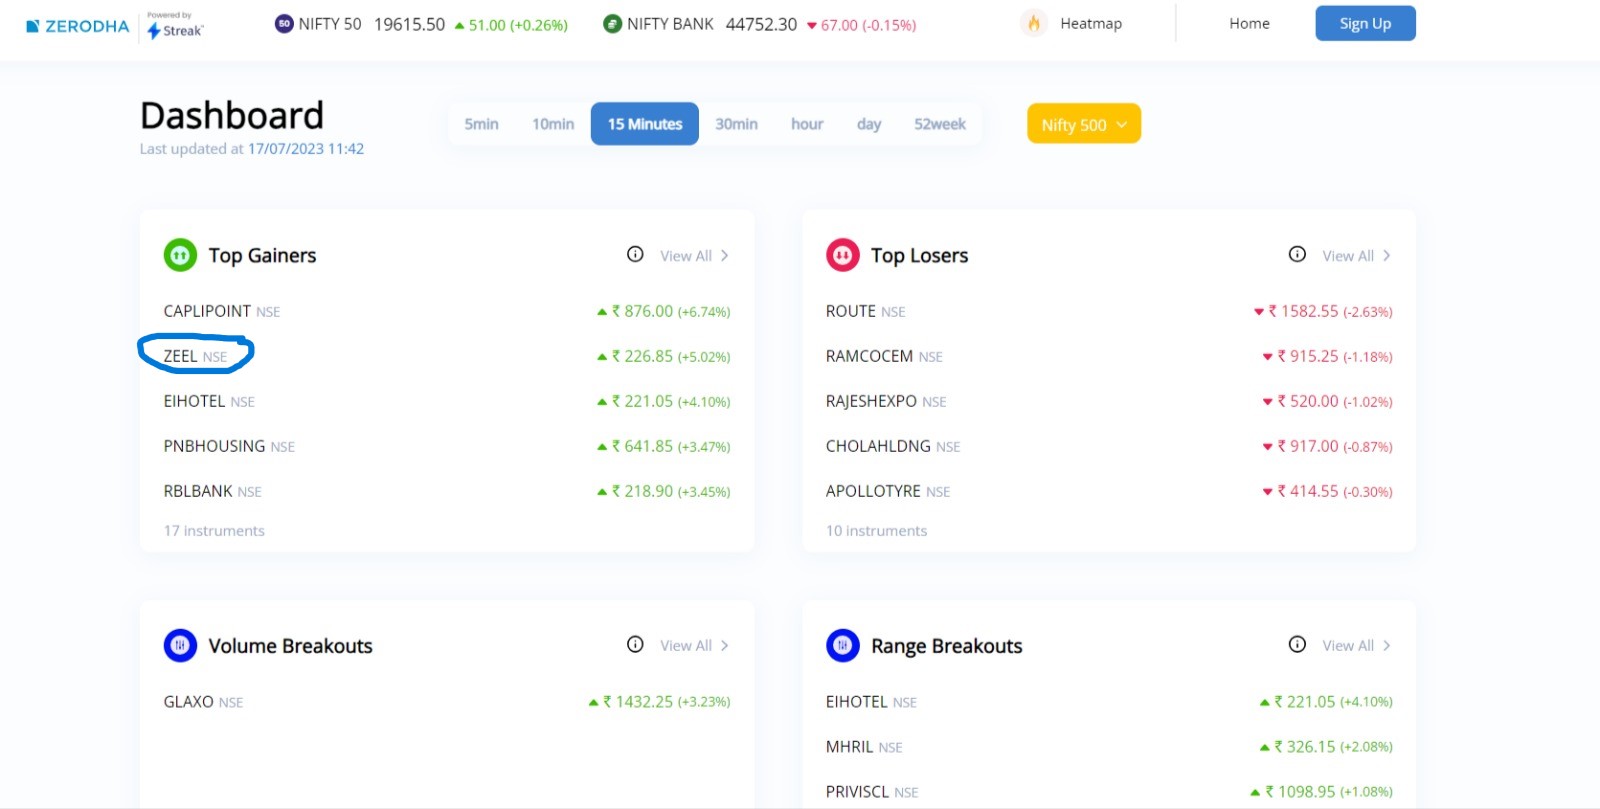
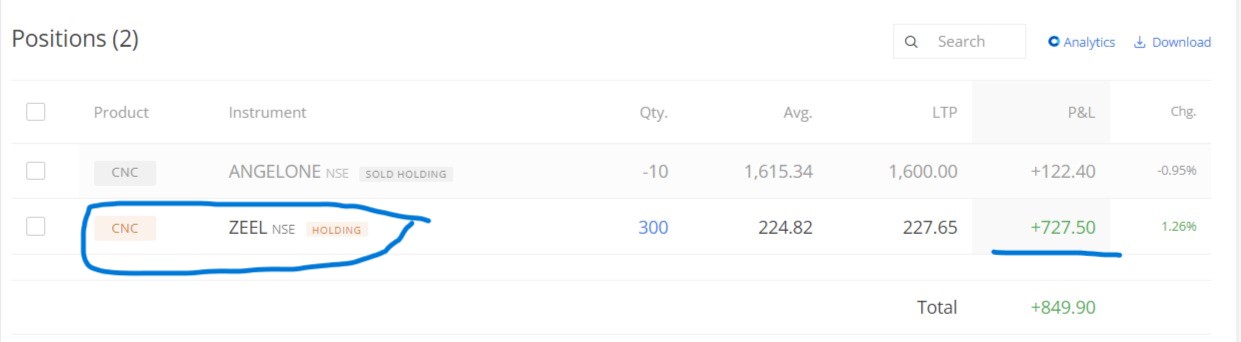
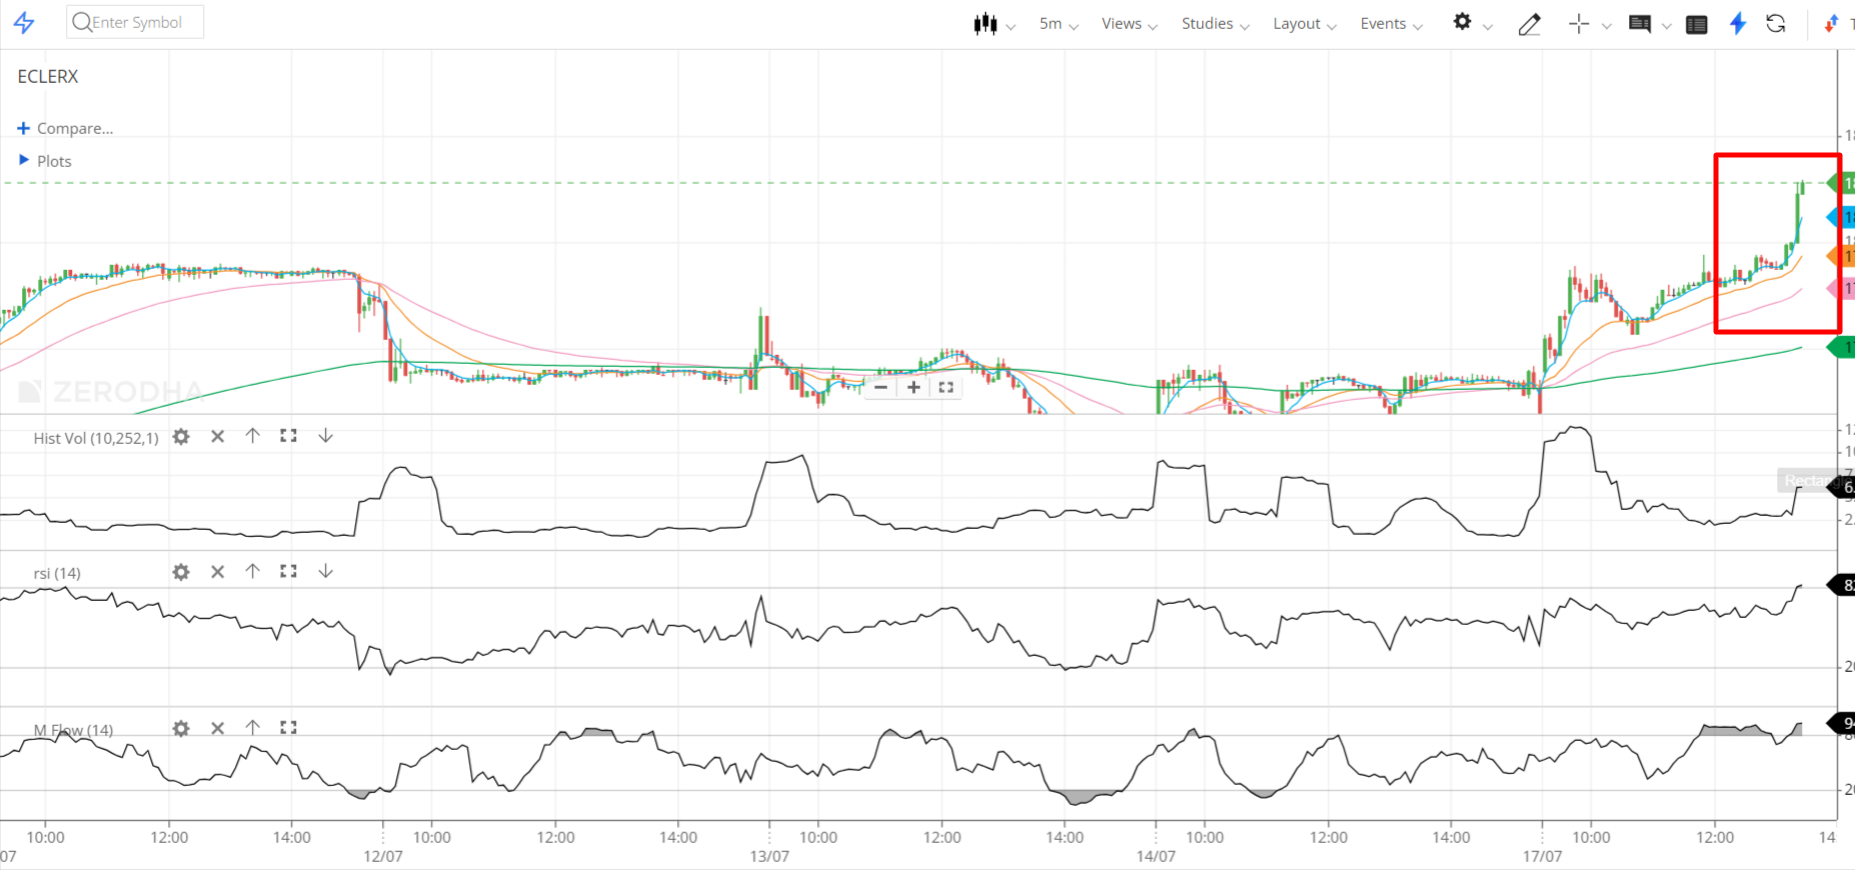
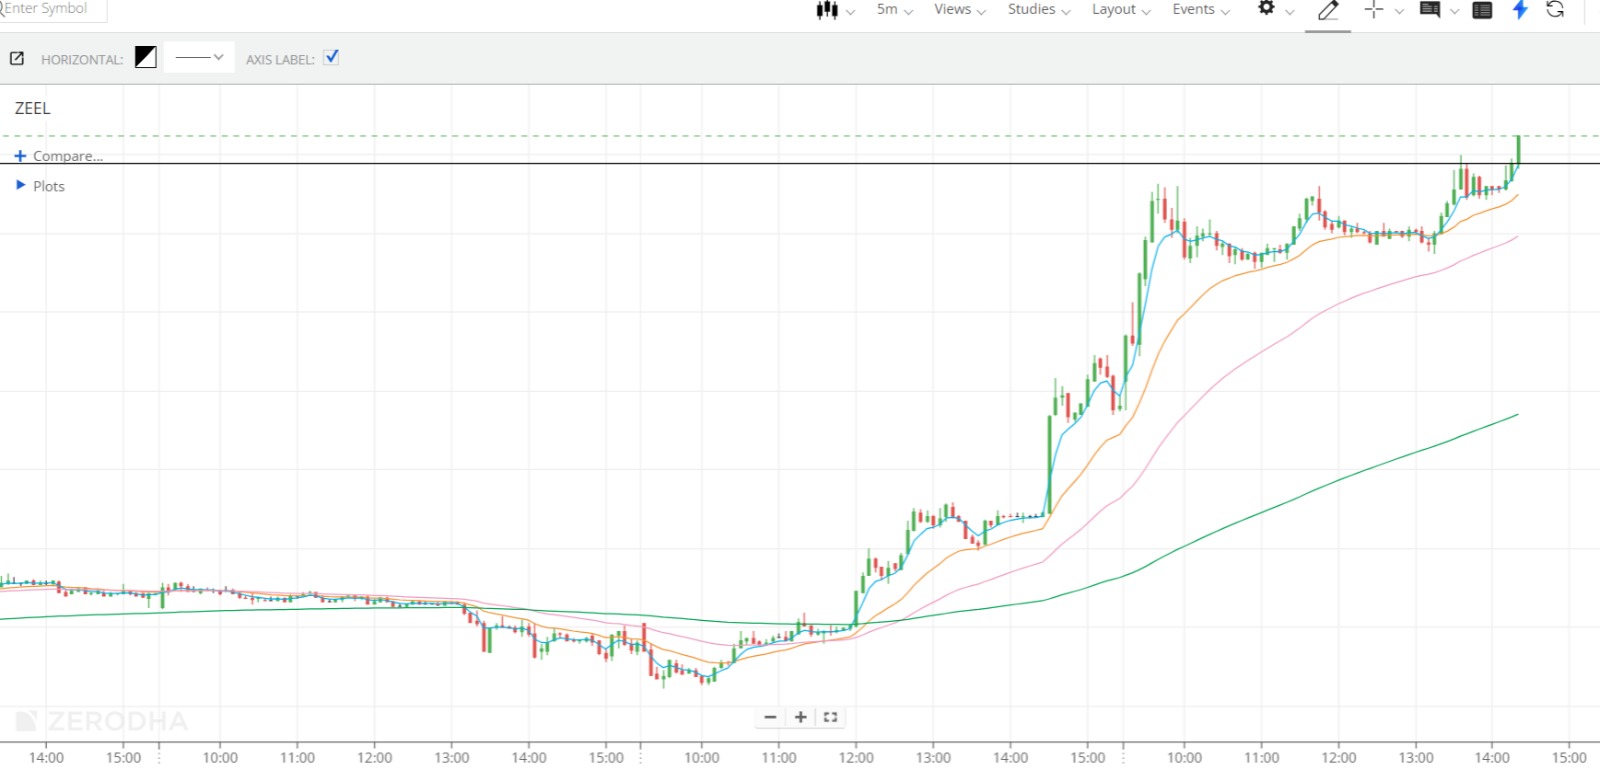
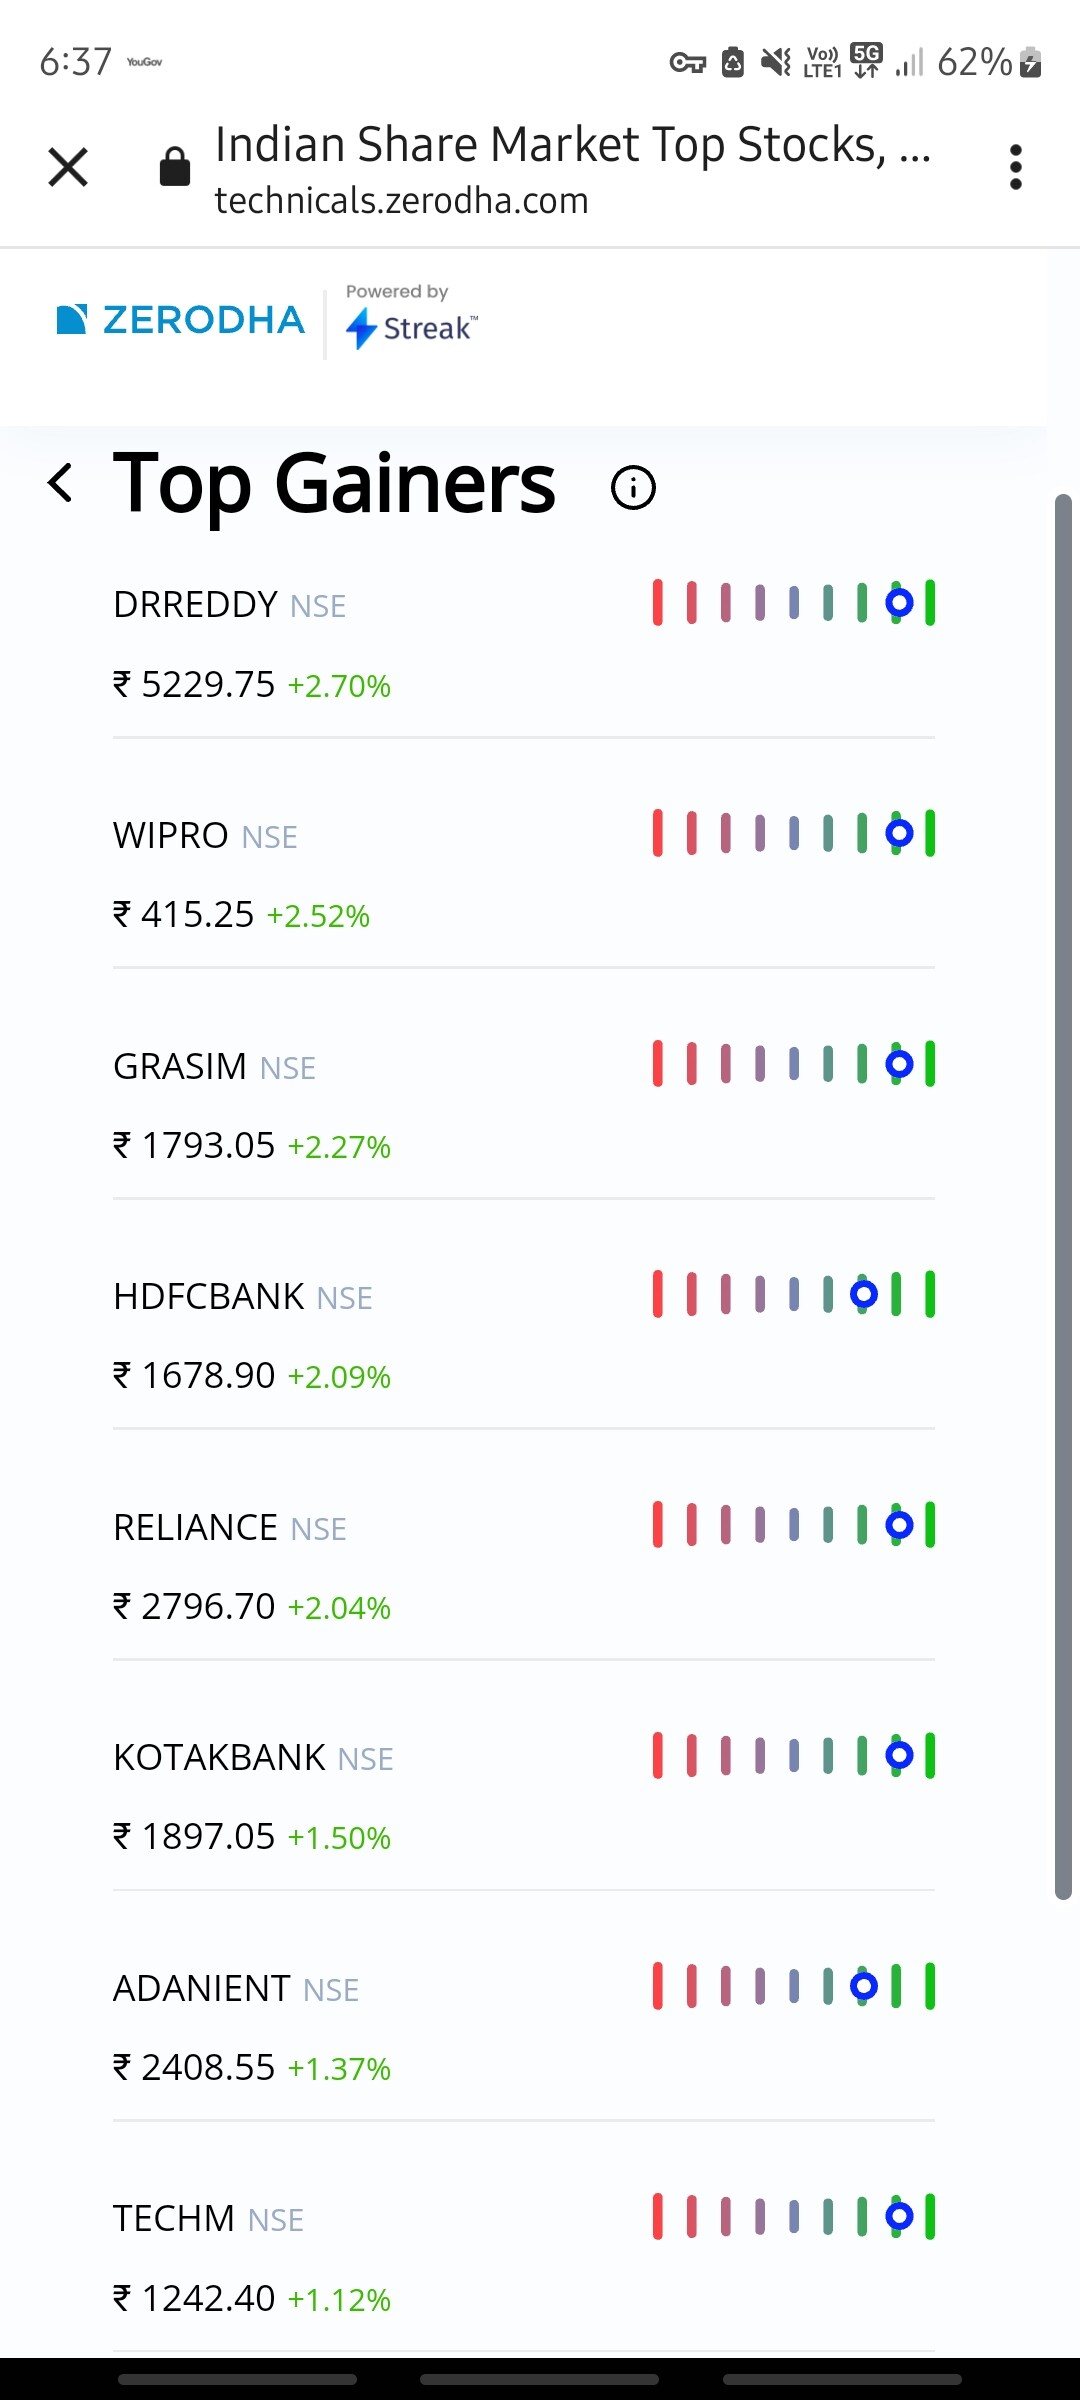
hi @Chetan_Nahata, ya so basically playing strength and ignoring weakness. so whichever stock is rising, we try to ride it and will ignore the falling stocks. The best candidate is one that’s making higher highs, trading, and taking support near 5 EMA and was positive on the previous day too. Traded Zeel today, pure momentum play
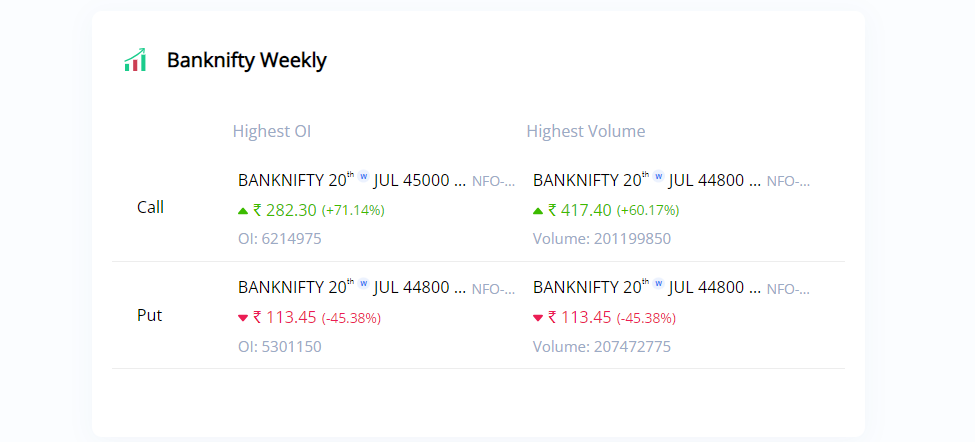
Highest OI and range is 45000 and 44800.
and BNF just crossed above 45000,
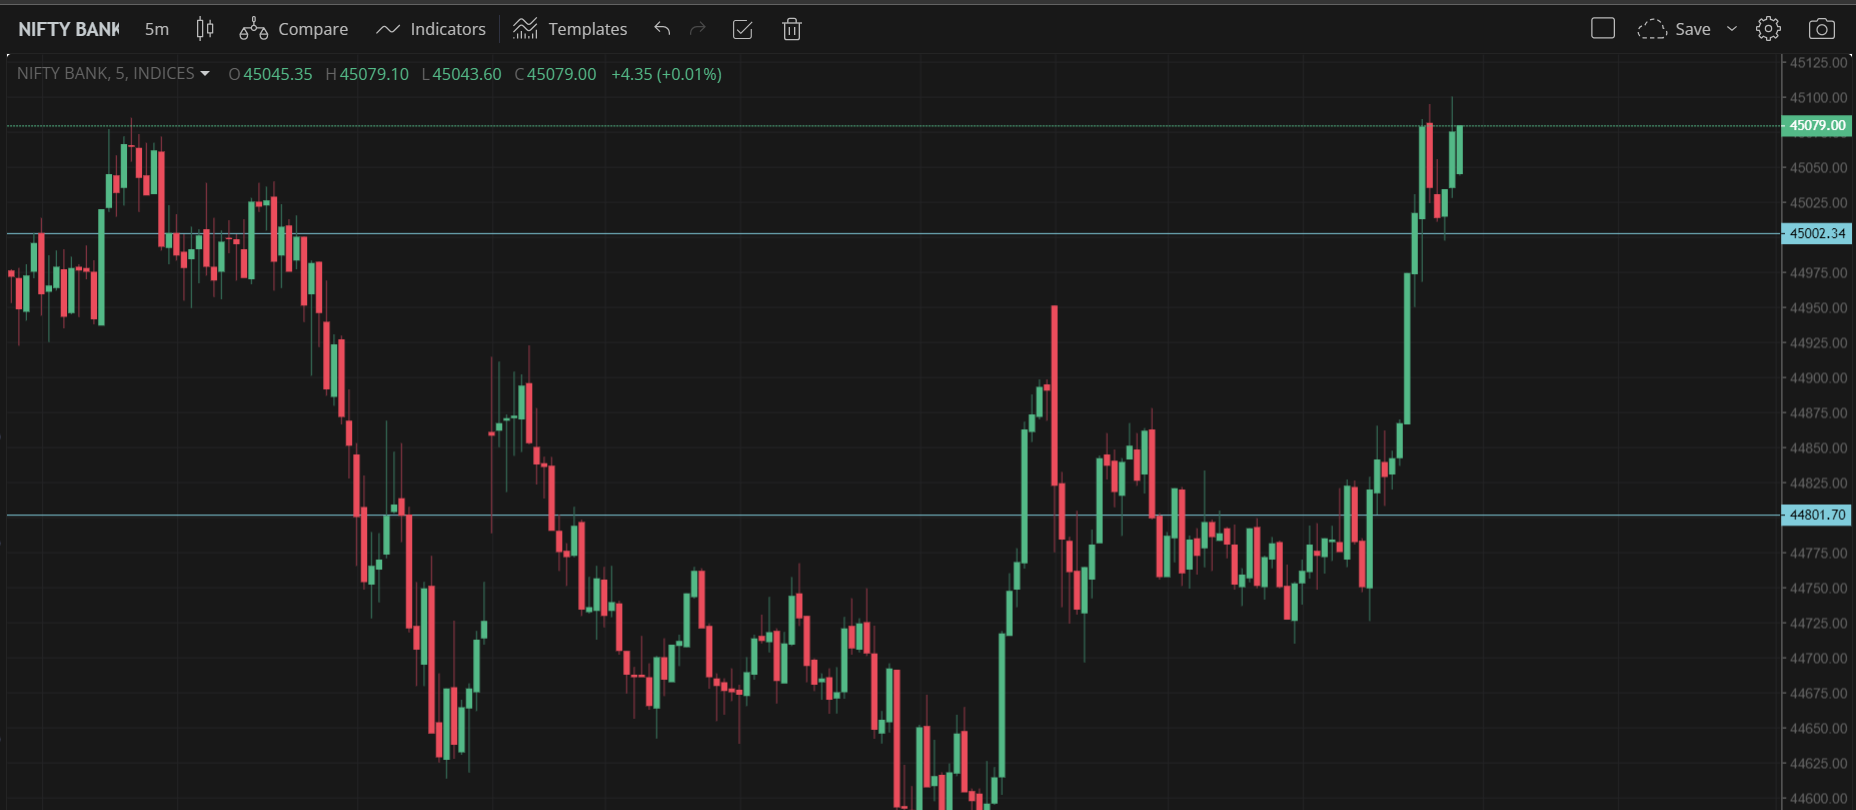
i think this has a bullish bias, lets see how it ends
2 Likes
Hi @Priyank_Mehta @Praneet_Kumar
Appreciate you sharing your insights here.
It would be great if you can a actively participate in the forum sharing your charts and other inputs. ![]()
You can share them in the below thread where we can get more coverage as other active traders can also participate in the conversation on a regular basis.

Interesting finding and posts everyone ![]()
1 Like
Nice cool feature @Zerodha and @Streak.
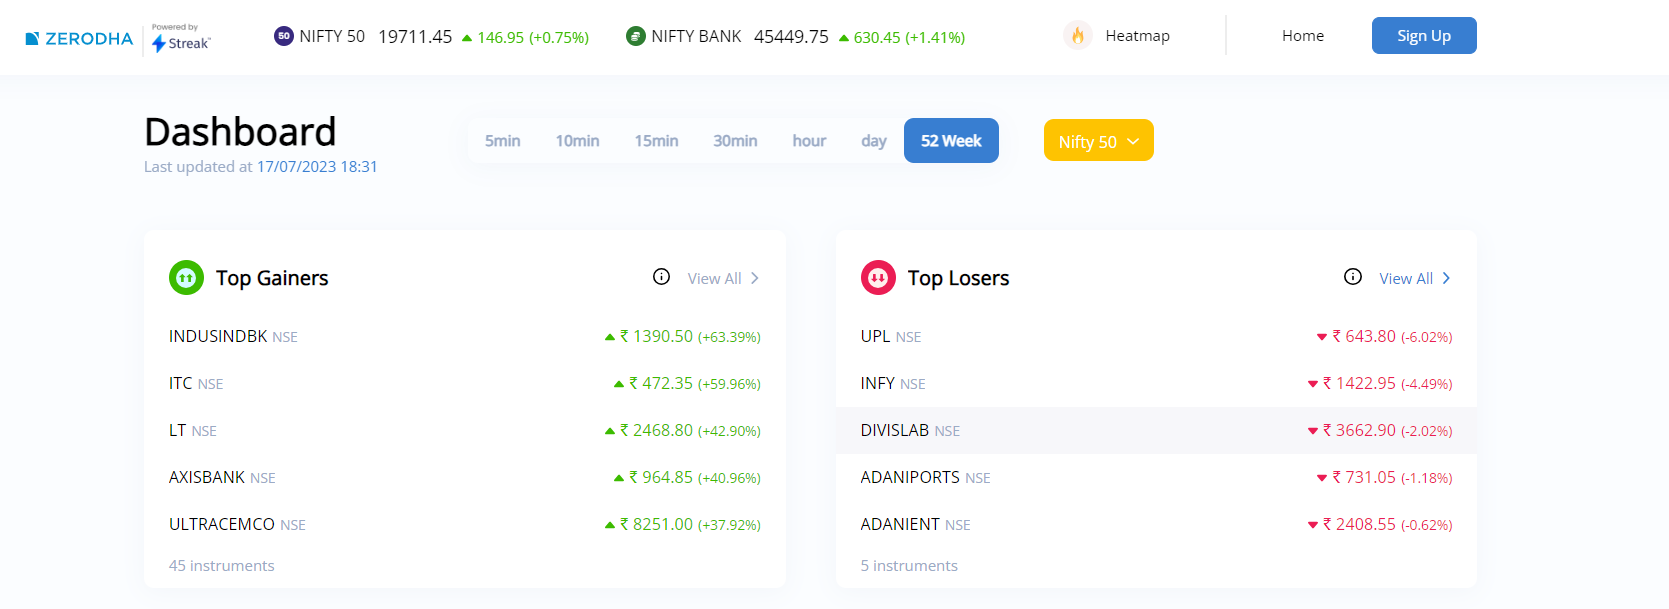
A quick market technical snapshot helps. Scared to see AngelOne’s scrip in the list though. Tough times ahead.
1 Like
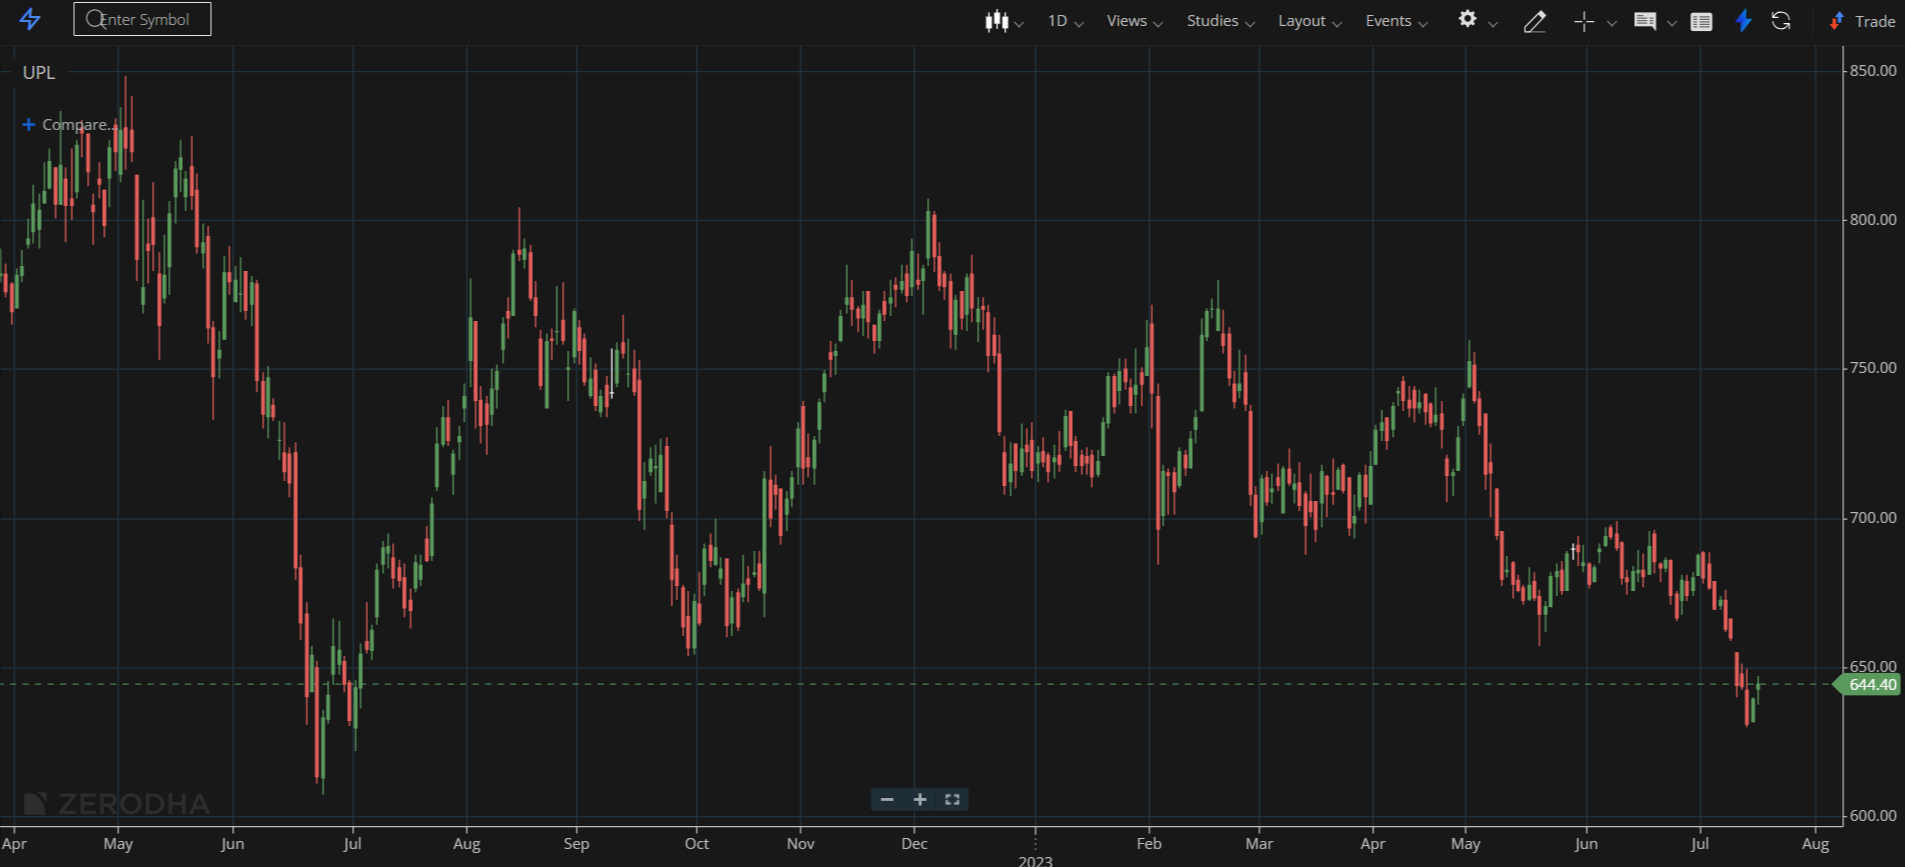
yes look like that. So are you shorting it or looking for a contra trade?
does data updated automatically or do we have to refresh page ?
heat map data should be updated without refreshing page.


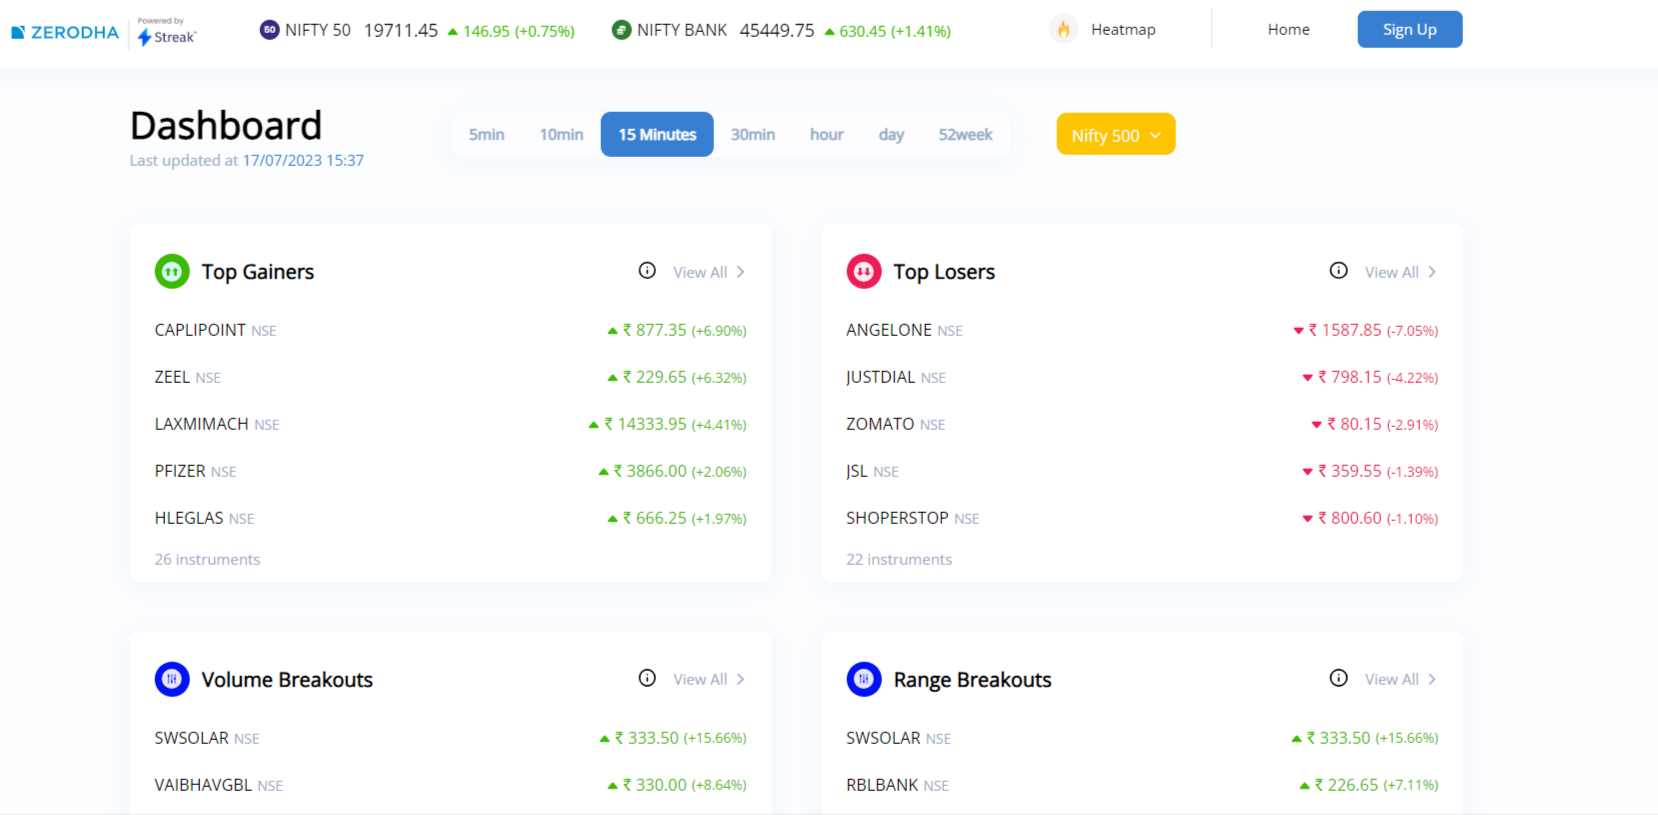
so i am using this tool as shown below:
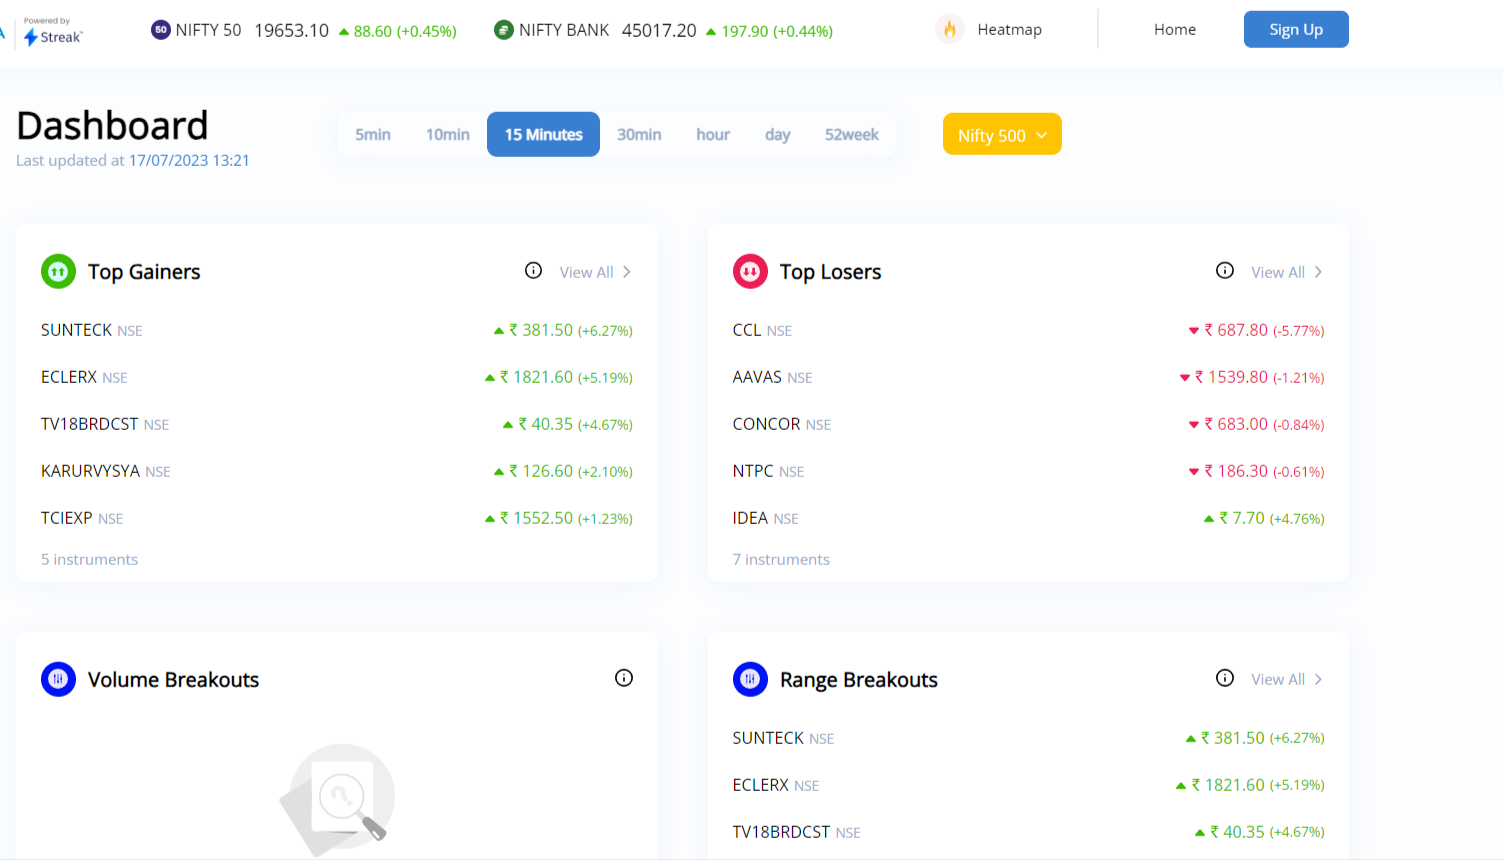
I am a swing trader, so i will check the higher time frames for the overall trend and shorter timeframes for entry points. Now with the Technical tool and market breadth visible together. you can see in the above video that for 30mins the breadth is better and bullish. But for 1hour and 1 day it is neutral to bearish.
So it’s safe to say, the overall bias is neutral to bearish and i will not be taking a strong buying position as of now. Maybe a bear call spread would be a better strategy to employ right now.
@ShubhS9 - Can this page be set to auto refresh? Also how delayed is the data or is it updated real time?