@siva-reddy
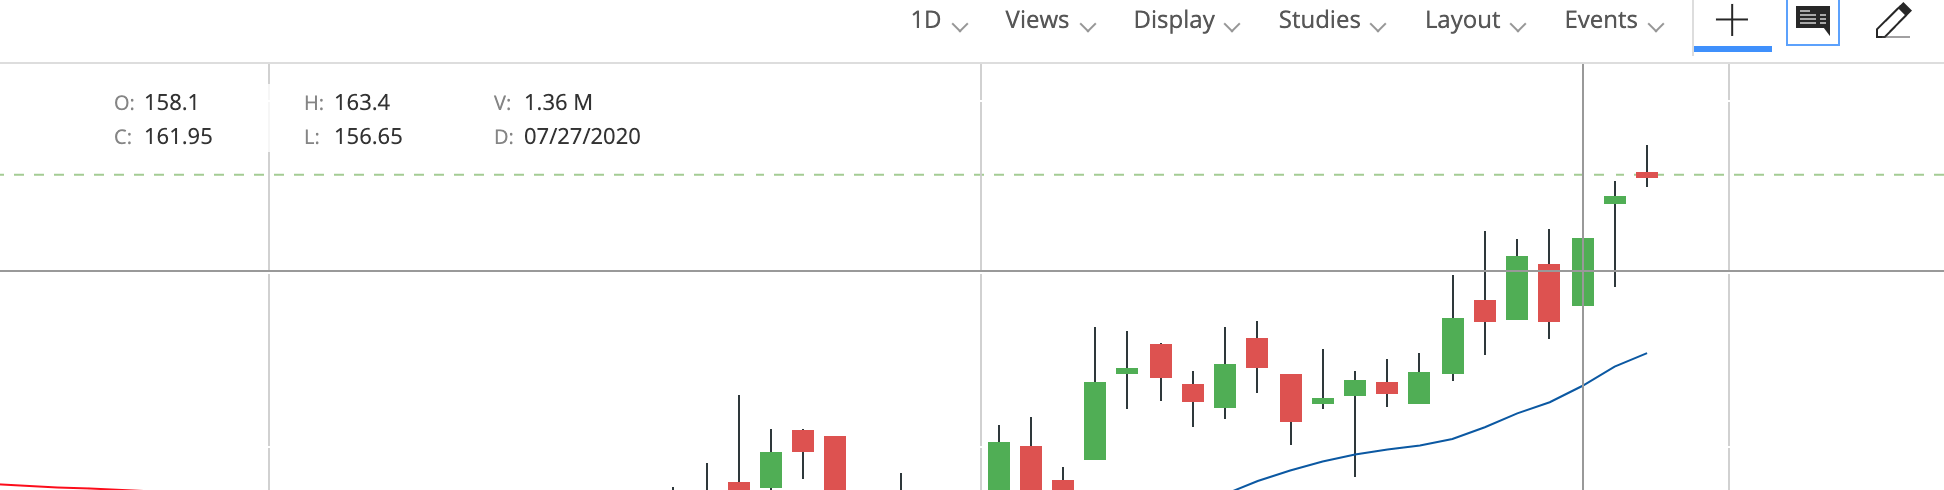
Is there any option to view the percentage change for the daily candles, when i hover on them all i could see are o,h,l,c values?
Gmail is almost twice bigger than kite in my system. But I had not seen any issues with Gmail (or tradingnview.com) if I keep the tab open for long time.
With kite, it is very visible.
In Gmail JS heap stays under 40MB in my system. But in Kite, it starts with little less than 20MB (great) BUT it keeps increasing; which is my complaint.
1 Like
200MB or so. But as I mentioned earlier, I end up killing the tab/app and re-open to get it usable. I could not check then whats the worst case.
Curious thing is; In freshly open kite web, Ican use the orders/positions page and 2 or 3 pop-out charts without any issue. The problem is I cannot continue using it.
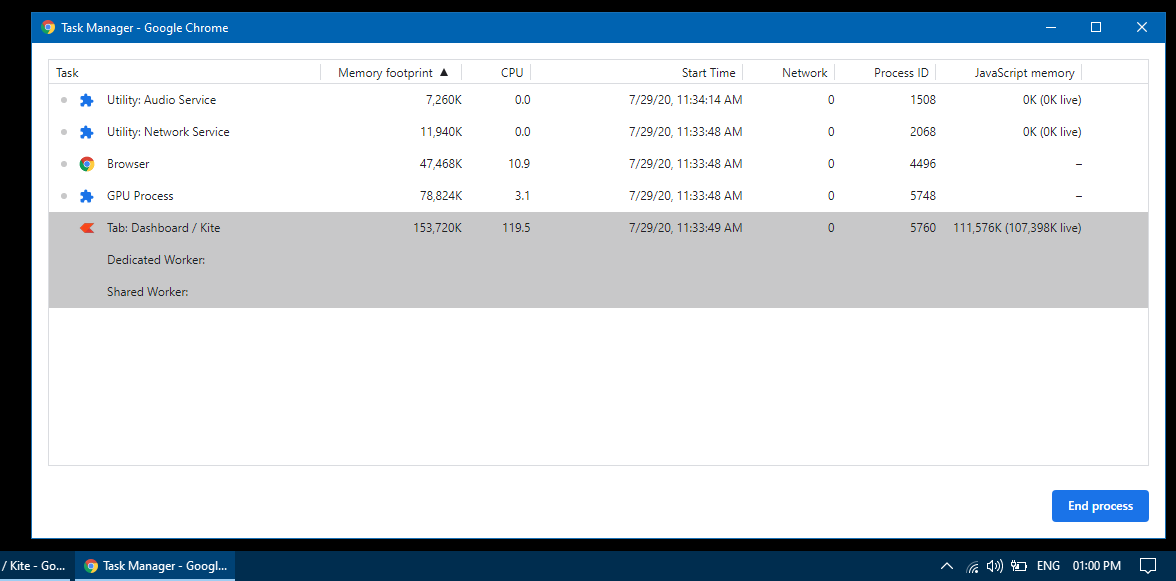
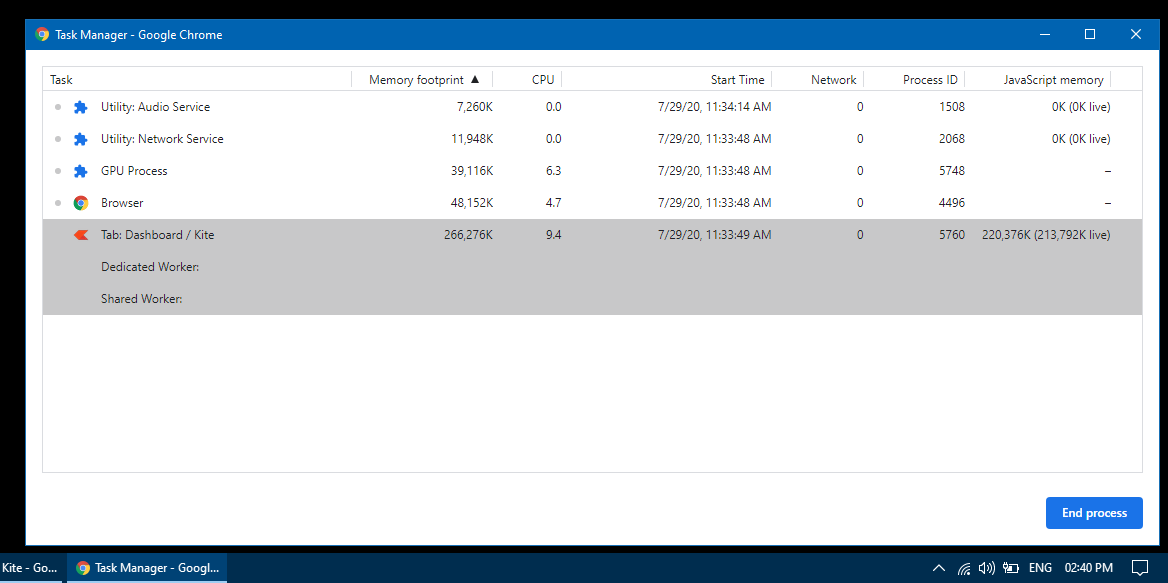
Just now, checked again. I kept kite dashboard open with 10 instruments, 2 of them on ticker. In under 15 minutes, the JS heap went 50MB from 20MB. I had not opened any chart or mkt depth or navigated within kite anywhere else. Just dashboard with mktwatch ticking.
I will see if I can do this test for an hour.
As I said earlier avg is 70 to 80 MB, it can go high but may come down again to avg. This is very minimal even compared to gmail as you mentioned.
I wish it is true… (that staying “relatively stable” and avg about 80MB); but it is not.
Some pictures might help you understand. I took screenshots over 2 hour period. Before every screenshot, I went to devtools and “collected garbage” which is like cleaning up cache. That freed few MBs immediately. Else these numbers will be about 10MB bigger.
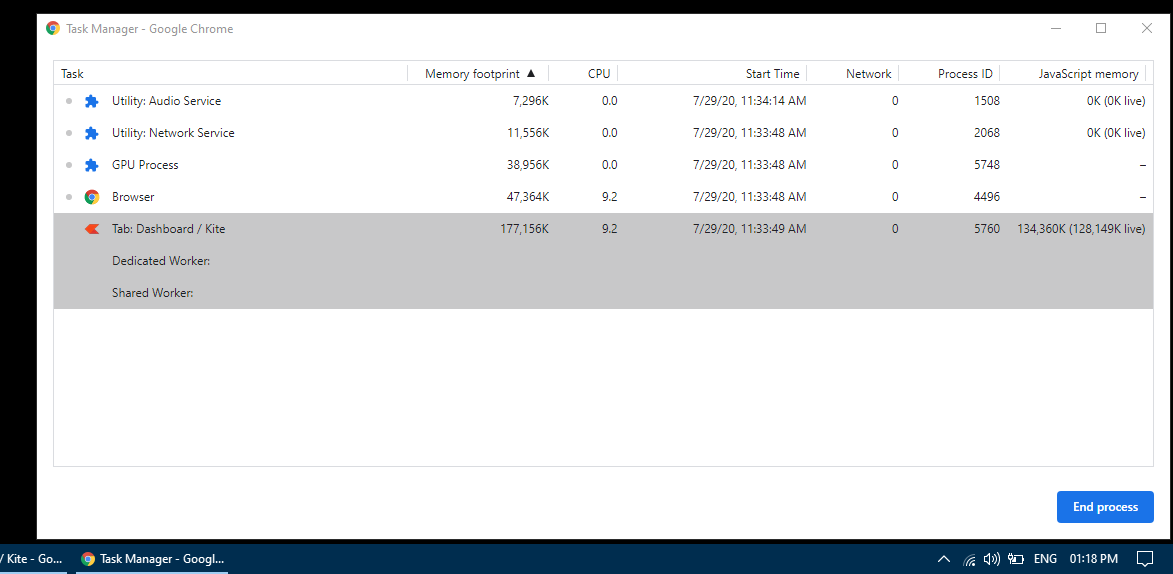
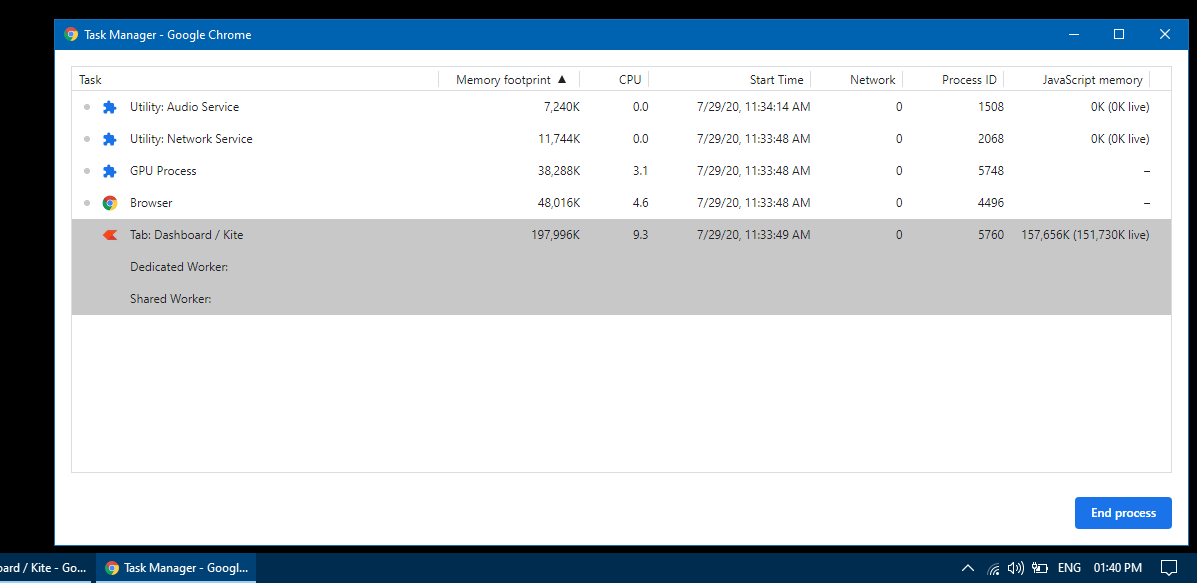
The dashboard has 10 scrips receiving ticks; no mkt-depth or chart are opened. The memory usage keeps going up.
You have to explain that how this is average 80MB … To my eyes, it is close to 200MB after two hours. The javascript memory went from 20MB to 150MB. If this is not a problem … then I do not know what is.
and , this is all when just dashboard is open; no charts, no mkt-depths.
Uploading: 1318.png…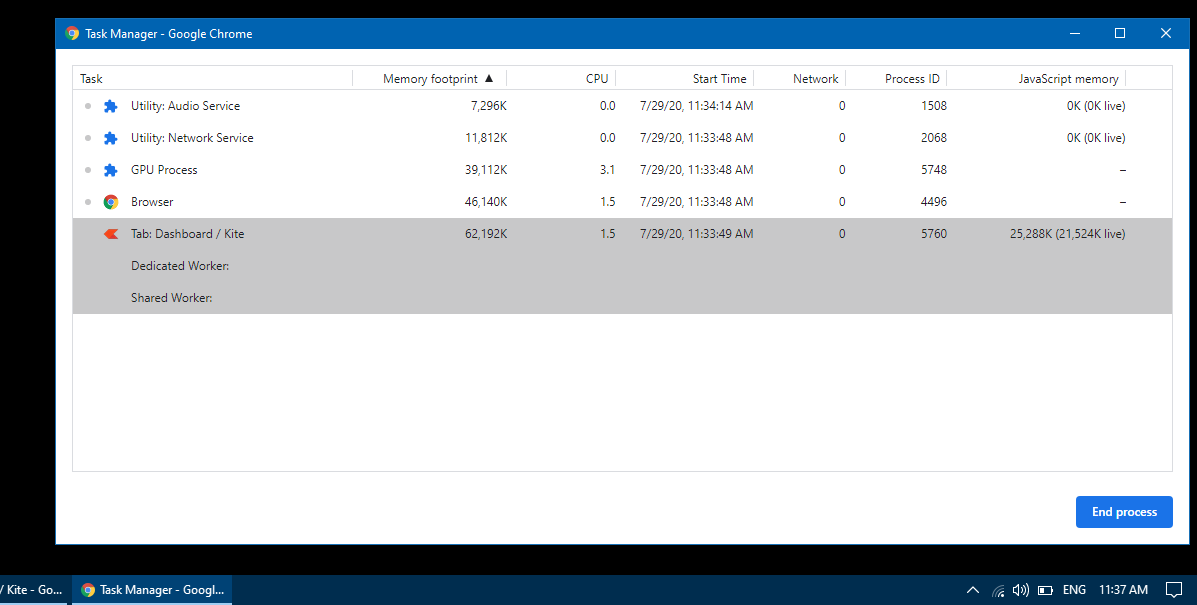
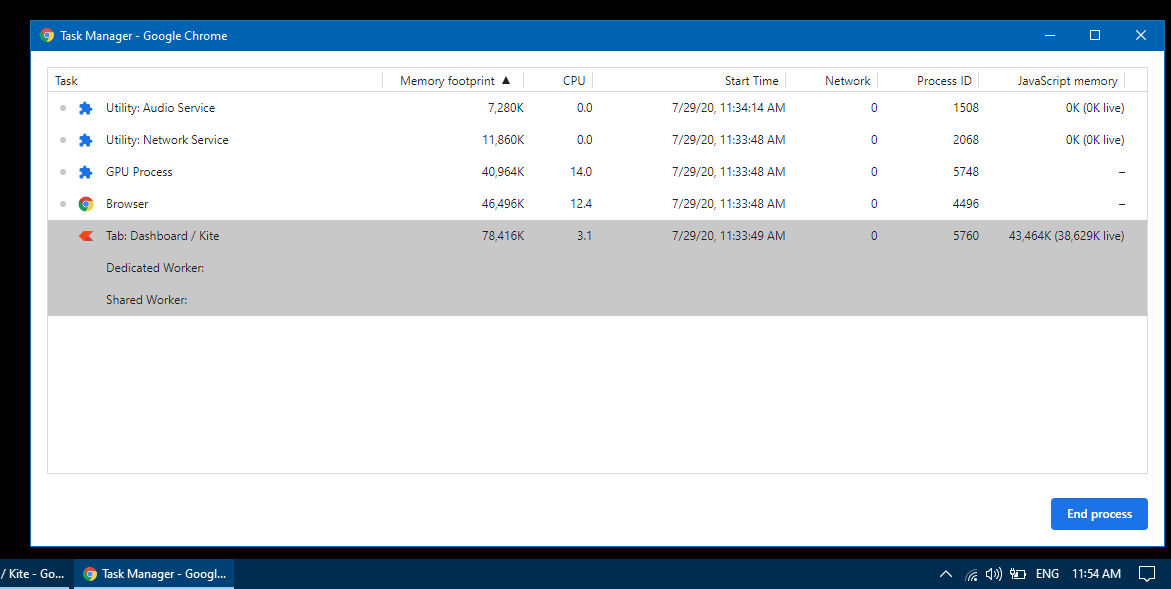
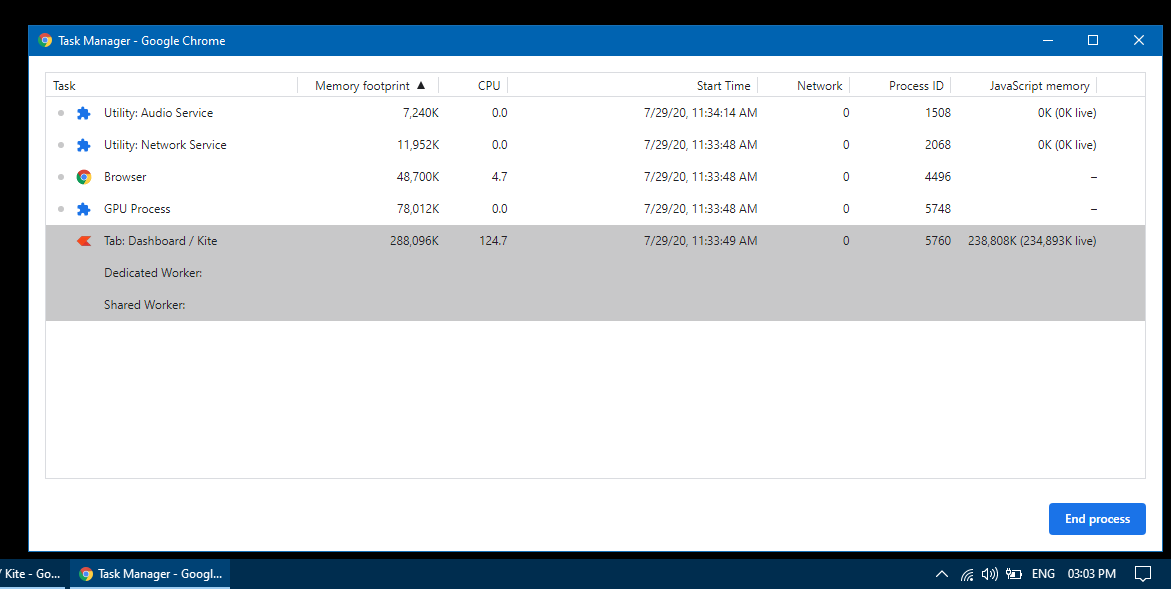
3 hours passed and …
As you see, in 3 hours the memory usage is only increasing, from 60MB to 260+ MB. And … this is when the app is just on dashboard page and no market-depth or chart is open.
I want to reiterate that the high memory usage is not a problem at all. If it is 80MB average (even 100 or 120MB) but is relatively stable, that will be very great and I will be happier than anyone.
But … that is not happening here. The memory usage is steadily increasing. All this is with just dashboard (and this does not happen when no scrips receive price updates). I have 2 decades of IT experience, on technical side. We call this memory leak. Please fix it.
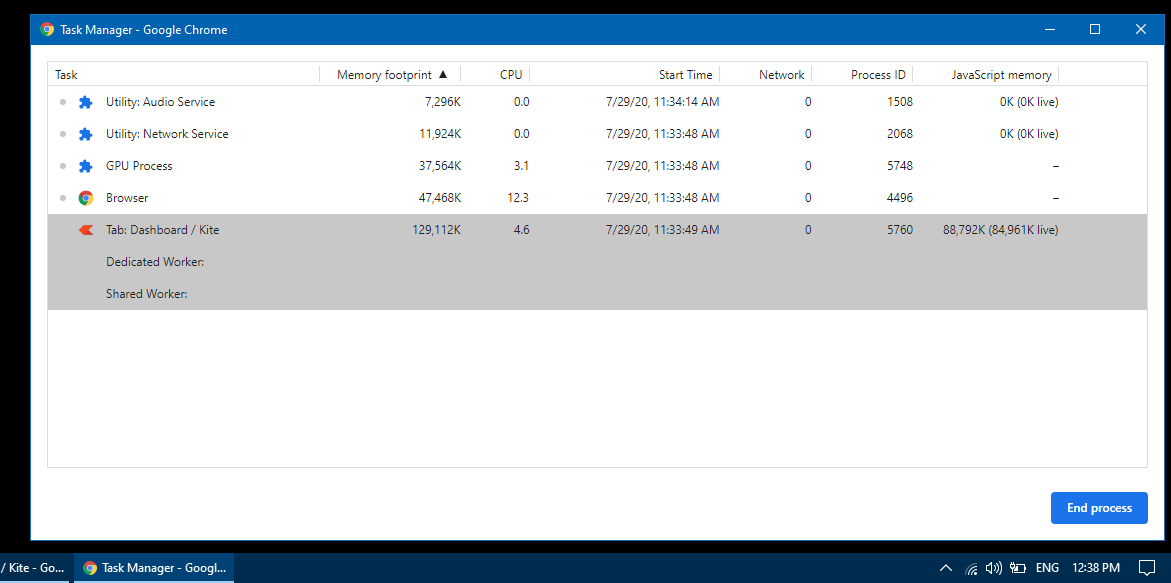
Another 20 or so minutes passed and here it is … another 20 or so MB gone. A total of 280MB for dashboard. Kite is indeed flying very high… ![]()
1 Like
@kars, You should consider my suggestion. Nothing will help you, though you get top config Process, Kite will again creates slowdown. unless you shift to Hard drive to SSD format
Thanks for your kind advice. I am a tech person myself with enough experience to judge these things.
I use an ultra-portable laptop for trading for various reasons. It is of-course, by today’s standards, a low config. But it is not really so. It has enough power and I am good at keeping things tidy. I can juggle along with few kite tabs … 2 or 3 charts and orders/positions page on their own tabs; total of 4 or 5 tabs for kite app … and few more apps like brokerage calculator, notes taking app, email, telegram, pdf reader, music player etc simultaneously . No problem at all. After an hour or so, those kite tabs become a problem. Even now, I have both chrome and firefox running. In fact, if my system resources are the problem, I could not open those tabs to start with. Because they use more memory and CPU while starting; all kinds initialization and stuff.
@kars. Could be. Take a look at what i said. If you still face the issue of what you mentioned, I will buy you a new laptop of whatever the config you ask for. Let me share my exp. Whatever you mentioned, I faced the same issue in 2017’s early days of trading. first 20 to 30 minutes everthing works fine, I trade with large amount. i lost continiously for more than enough times, i couldn’t understand the problem, first, i yelled at zerodha, then customer service. Like this i continued for few more months. Finally i tested with SSD. Since then, My pc never got stuck. It’s not just multi taksing! PC will act like a BEAST to handle any opertations in seconds. Just try and you won’t regret. And trust me, no customer care will help you, becuase they itself dont know.
My laptop already uses SSD and more than half of it is free.
I am also sure if I use a bigger config, I wont have problems … with tabs not responding etc. But that does not fix the kite app eating away memory all the time it is open. Let us say I keep kite app open from 8:30 to 5:30 … for 9 hours … Kite app will leak about 1GB memory. With a good system, more memory, SSD etc… the problem will not be noticeable. But that does not mean there is no problem.
Ultra-portable is by choice. It is fanless, thus no noise, very good battery life and cheap enough to carry everywhere I go without much fuss about bags, chargers etc.
Didnt I say I am a techie myself? I can workaround this memory issue myself. Simply, I can automate closing the kite tab and open a new tab periodically. I already have few things … please check
1 Like
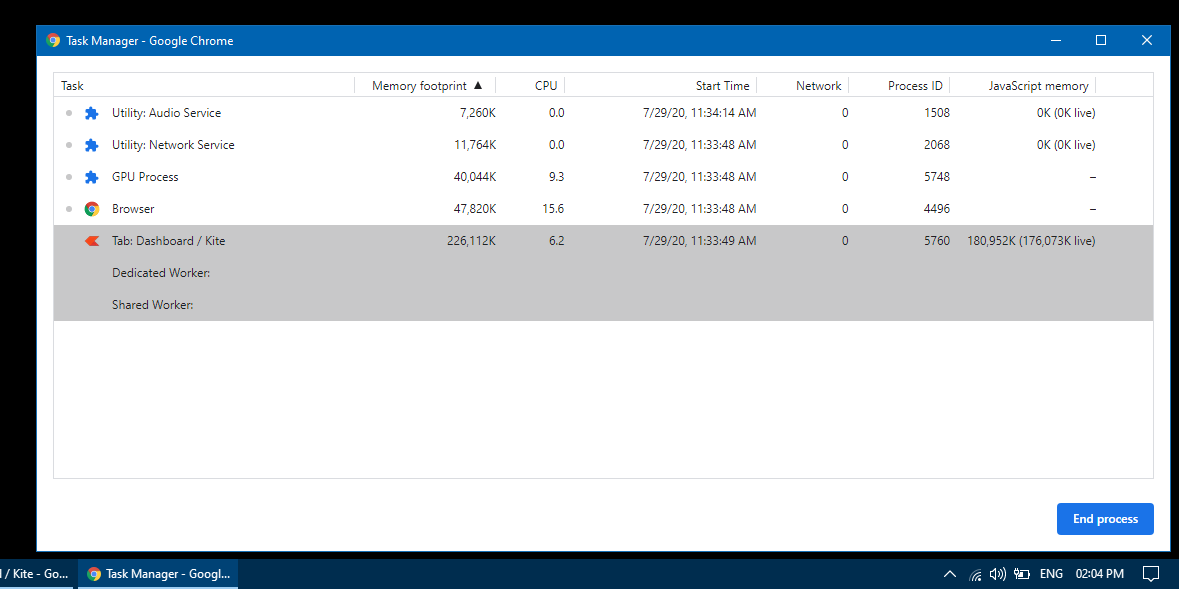
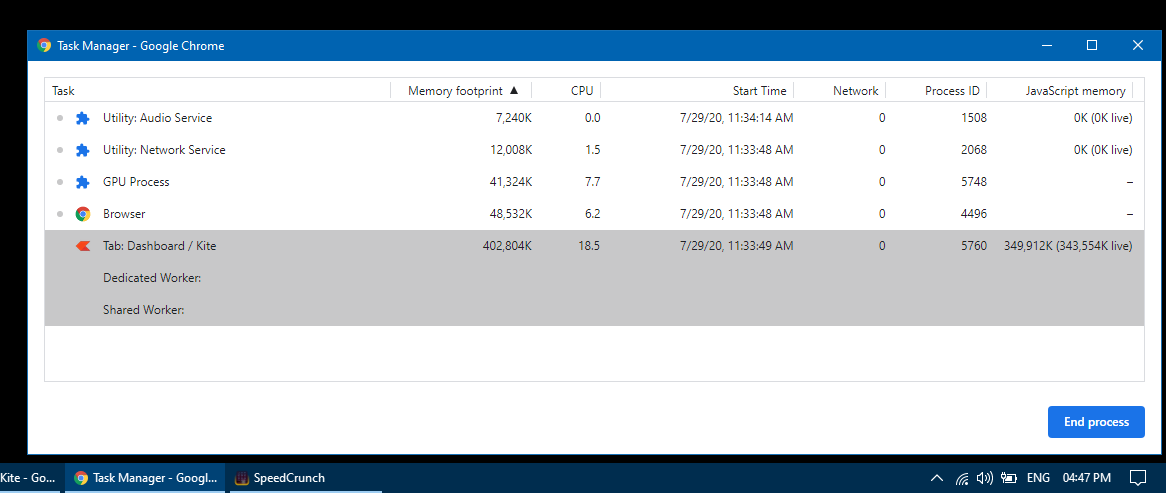
Here is what happens after 5 hours of just dashboard tab … 400 MB total for the page in which 340 MB is Java-script memory.
The tab started with about 60 MB total (of which 20MB is JS heap). 40MB (without JS heap) memory footprint increased to 60MB after 5 hours. 20MB memory use of java-script use went on to 340MB. A increase of 20MB to 40MB JS is surely acceptable. That will make the tab use 100MB. But a total of 400MB?
Where is your average of 80 MB or so? Is your team justifying 400MB ? I am sure if I keep it open till 11:30PM, for MCX, another 7 hours, the dashboard will be close to 1GB.
Please do something. I do not want to be closing and re-opening tabs every now and then.
@nithin, would you please put a little nudge here?
Let us check for 5 hours tomorrow.
1 Like
Please … do anything … I will be happier to get it fixed.
Keep atleast 10 active instruments in the watchlist … i.e. receiving price updates. No need to open mkt-depth drawer or any chart.
You need 10 scrips so you can see the problem clearly and sooner. I want to watch lot more but because of this problem I cleaned up and settled down to atmost 10.
My laptop has 4 cores. If a process uses more than one core, then it will be more than 100%. A process can have many threads and they can run at the same time. If two threads were busy running when we check, we can see 200%. This is normal.
The issue you faced is a classic case of malware. Up to date Windows defender and a full scan is usually enough. If that does not help, reinstall. But double, triple and once again scan your backups. Better yet, do not restore backup data immediately … wait for a week or two and let antivirus definitions catch up. then scan again before using he data.
You are not looking properly. ![]()
The kite orders tab you keep open, it is using about 120 MB. It would have started about just 60 MB. 120 MB is not justifiable even if the page has to display 2000 orders which is hard limit per user per day by zerodha.
BTW, your BHEL chart memory usage is also added to your orders tab here. Because they are both same process. That makes difficult to be totally sure about the leak … in your testing And 45 minutes is not enough. By todays “standards” that usage can be brushed off as “normal” use.
And also as I said, there has to be instruments receiving price updates. As far as I checked, weekends and nights, when no price updates in my watch list, I do not see the leaky behaviour.
I have attached screenshots which goes from 11:30 to 4:30 pm… 5 hours. Look at how the usage is changing. Also look at how clean the process list is. I am not using any extensions (disabled the only 4 exts I use). And there are no other tabs open. All these because, I want to show the leak and did not like to hear those other things are causing the leak.
Well,
When I started complaining, I thought the problem might be my system and I was like “oh… crap …” whenever the tab took more time to respond. Once I noticed the cause, I started periodically closing n reopening tabs. It is not a work stopping bug now, for me. Just unacceptable annoyance.
As I mentioned in another post, opening new tabs, techically, should use more memory and cpu because of all the initialisation and stuff.
There is no reason to retain any data received in the dashboard page. Even if the kite dashboard kept those LTP updates of 12 instruments for 5 hours , assuming 3 ticks per second (we get max 1 or 2), the worsto worst case cannot be more than 40MB addition.
Lets accept that 40 MB worst case … where is 40MB and where is 340 MB of additional memory usage I had shown?
Will check tomorrow, it can go upto 150 or 200 but average should be around 80.
@siva-reddy Where can I get a description / manual of all the indicators / studies as they appear on Kite?
I checked this page - https://kite.trade/docs/kite/charting/#indicatorsstudies , but it doesn’t seem to list & describe the studies used in Kite.
For eg., if I want to better understand what Linear Reg Intercept / Forecast / R2 is, is there an official link in the manual / varsity that explains these studies?
Thanks.