For eg., if I want to better understand what Linear Reg Intercept / Forecast / R2 is, is there an official link in the manual / varsity that explains these studies?
It has nothing to do with system specs I guess. I use SSD ( 1 M.2 for OS and SATA SSD for storage), 8 GB RAM, and i7-6700 HQ processor.
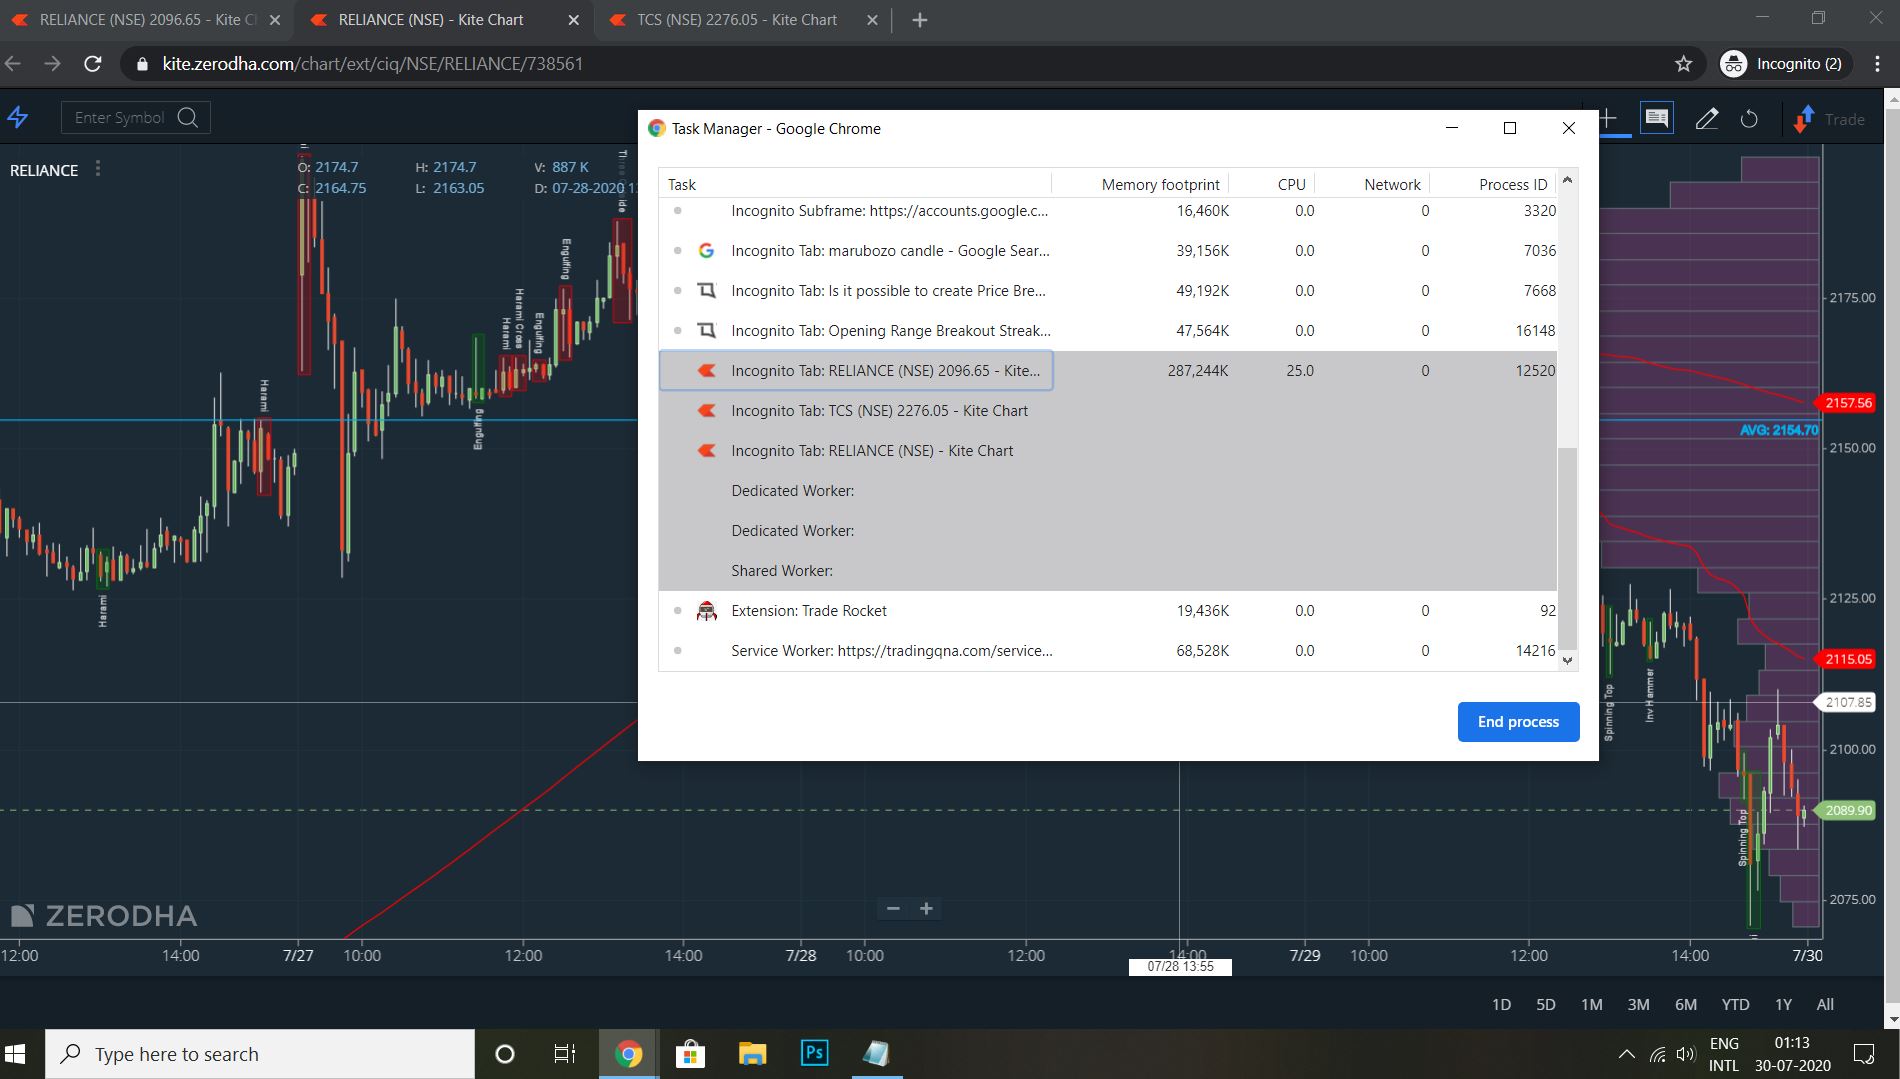
With all the above , I have been facing this issue from long. Uploading usage screenshot when I just logged in to Kite now 01:15 AM, and opened two charts.
The charts just freeze after a while. Especially the pop out charts stop loading the candles after an hour or two randomly. I have to restart all the tabs and load them all again. Learned to live with it for now.
@siva Please check if there is any work around. 280 MB for just 2 min session is too high I guess
I had not checked chart mem usage recently. Long back I had the same problem of missing ticks or wrong candles on 1 minute charts. I started clicking refresh chart button within the chart (not the browser reload) before I make any trade ideas. I have that automated now using violent monkey extension.
In your screen shot above, all three charts are done by same process. Traditionally it would mean lot of shared memory and thus overall less memory usage. But that is not the case most of the time now a days … If the usage is not keep growing over time, it should be fine; because it is written so.
However, in Kite, it looks like one websocket connection is shared for all tabs. And the browser is so intelligent it tries save us from the resource hungry applications and too many tabs opening style of our use. Tabs are suspended and they go to some lind of limbo state. This is so because originally the web is to display documents… if we are not looking, then no processing needs to be done there. right?
Thats why web is so unsuited for some style of interactive applications use. We open some tabs and leave it in background hoping it keeps on doing its work, till we come back after some time. This is not suitable at all… either the tab is open and on use or we should close.
My complaint is … I am actively using the main tab and need it open … but the mem usage keep going up till the point the tab is unusable. I can open new tabs for charts and close them once done. I can understand the interdependence. But if I have to close and open the main page, it is pathetic.
Some apps are really great, like tradingview it is snappy and responsive. Some microsoft online apps are heavy but stable and reliable.
Kite only feels superficially good. It looks polished only because it looks bare … which is clutter free look for many people. But it makes lot of workflows hard and some impossible.
I think kite web is not for active traders. I should look more on kite api and custom solutions … not that I trade that much …
This evening when after market hours, I noticed the same problem. So I tested dashboard again with only two indices, not receiving any price updates. The problem is still there. I had probably made a mistake believing no-price-updates means no memory usage increase.
May be your team had done something to debug? Anyway, the problem is even worse than I thought, since kite app leaks memory all the time.
@nithin, please step in and follow-up this issue a little. Please.
Team is debugging,these things are not easy to figure out and takes time. Also it’s not as bad as you are saying else we would have got several complaints already. Anyway since we care about out clients we will investigate and try to optimize it. You are the 1st client to report this, anyway appreciate for reporting.
Thanks. I’m happy that your team is debugging the issue. So there is indeed a problem. Good.
It is not thay everyone will notice this issue. An extra 1GB RAM spare, you wont notice even after a whole day.
I dont trade much; i leave kite windows open and keep mulling over what to do. By the time I get a conviction the kite tab behaves so sluggish I lose my cool then.
I hope your team fix this sooner.
PS: Browsers esecially chrome have great debugging tools and I really wonder why this takes so long. That probably mean the problem is not with your code but with VUE or with other libraries or with the minifier you use. I checked with firefox, It also has the issue. So something wrong with kite web. I not a JS person, even then I cannot ask for your un-obscured source coe. right?