We had a session by @Karthik on Stock picking techniques - Insights from cash flow statements, If you have any queries for Karthik please post them here and have them answered. You can watch the video and also check out the Varsity module on analyzing a cash flow statement for more.
How to collect those information for making such decision?
Like when one see a financial report of a company, how can one bifurcate those income, expenses into these different categories especially the finance part?
Hey, @Karthik! Thanks for the incredibly wonderful session. I just had a few follow-up questions:
Can a negative cash flow from operating expenses ever be a good thing? Especially if it happens more than once or twice in the last 5-10 fiscal years?
Generally, we should prefer a company that is on a growing trajectory, this would mean that it keeps on investing in itself. This is especially true for small/mid cap companies that have enough room for growth. Now in such a case, if the company shows a net inflow of cash from investing activities (positive IA CF), is that a bad sign in general implying that the company isn’t being aggressive enough?
Can we get the 10 year cash flow data from Annual Reports? I use Screener or Ratestar for now. Did you have to manually enter all that info into Excel?
Pardon the noob questions, I’ve only begin with direct equity investments. Thanks again for your work on this session and Varsity!
Thank you, I’m glad you liked the session [quote=“NewInvestor, post:5, topic:11894”]
Can a negative cash flow from operating expenses ever be a good thing? Especially if it happens more than once or twice in the last 5-10 fiscal years?
[/quote]
I personally dont like investing in such companies. When I invest in a stock for a long term, I expect to see stable, long term +ve CF from operations. However, there are companies on the verge of raising from the lows (from consistent -ve CF to turning +ve), hard to find, but if you do, can be a stellar investment[quote=“NewInvestor, post:5, topic:11894”]
Generally, we should prefer a company that is on a growing trajectory, this would mean that it keeps on investing in itself. This is especially true for small/mid cap companies that have enough room for growth. Now in such a case, if the company shows a net inflow of cash from investing activities (positive IA CF), is that a bad sign in general implying that the company isn’t being aggressive enough?
[/quote]
Look for the CF from IA and correlated to what the managenment has to say in Management Discussion & Analysis. If the management is talking about investments and CAPEX expansion but the CF from IA is not impressing, then thats something you need to watch out for [quote=“NewInvestor, post:5, topic:11894”]
Can we get the 10 year cash flow data from Annual Reports? I use Screener or Ratestar for now. Did you have to manually enter all that info into Excel?
[/quote]
I extracted it from screener too, expecting the numbers to be accurate. However, you can visit the companies website (look under the investors section) and download the ARs and therefore the historical CF numbers[quote=“NewInvestor, post:5, topic:11894”]
Pardon the noob questions, I’ve only begin with direct equity investments. Thanks again for your work on this session and Varsity!
[/quote]
Thanks @Karthik! One last question - While looking at cashflow statements, should we prefer standalone numbers, consolidated numbers or both? Generally, we tend to favour consolidated numbers, but I’m not sure about CF statements.
Dear Karthik,
Thanks for the video. Hopefully, you will create (or convert) all varsity content into this kind of high class videos. One could just go thru’ the videos at 2x speed and understand the nitty grities!
I am a trader. And i mostly rely on charting for my trading decisions. But i found your cash flow statement concept interesting so i have seen many cash flow statements of various stocks after i watched your video.
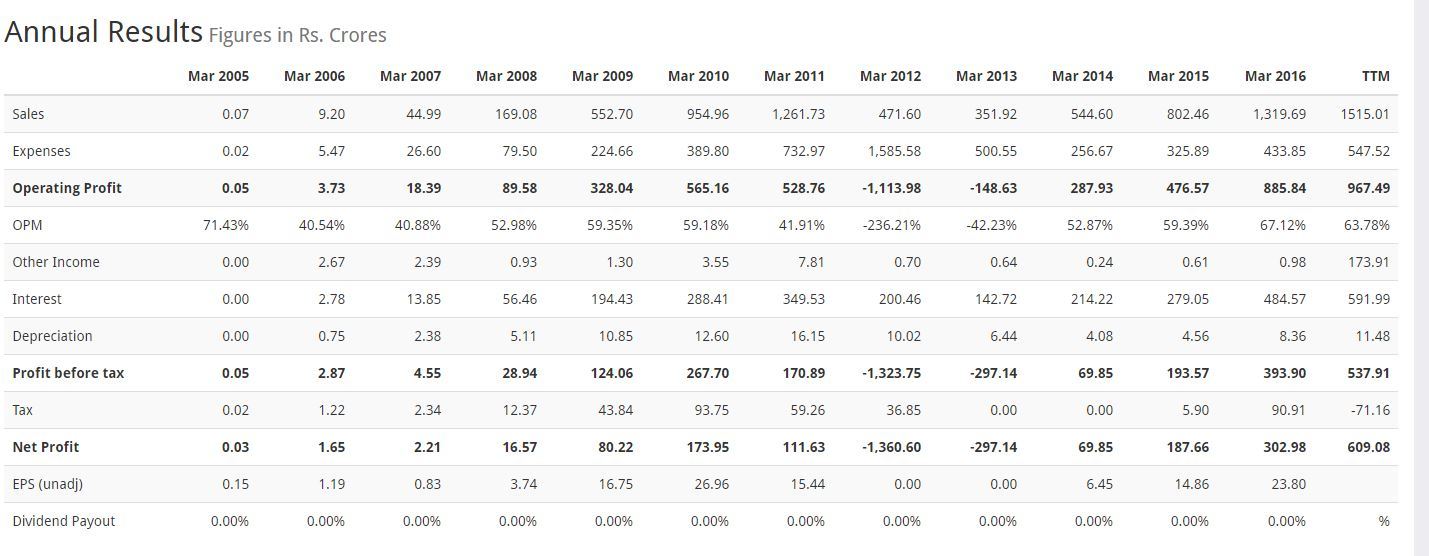
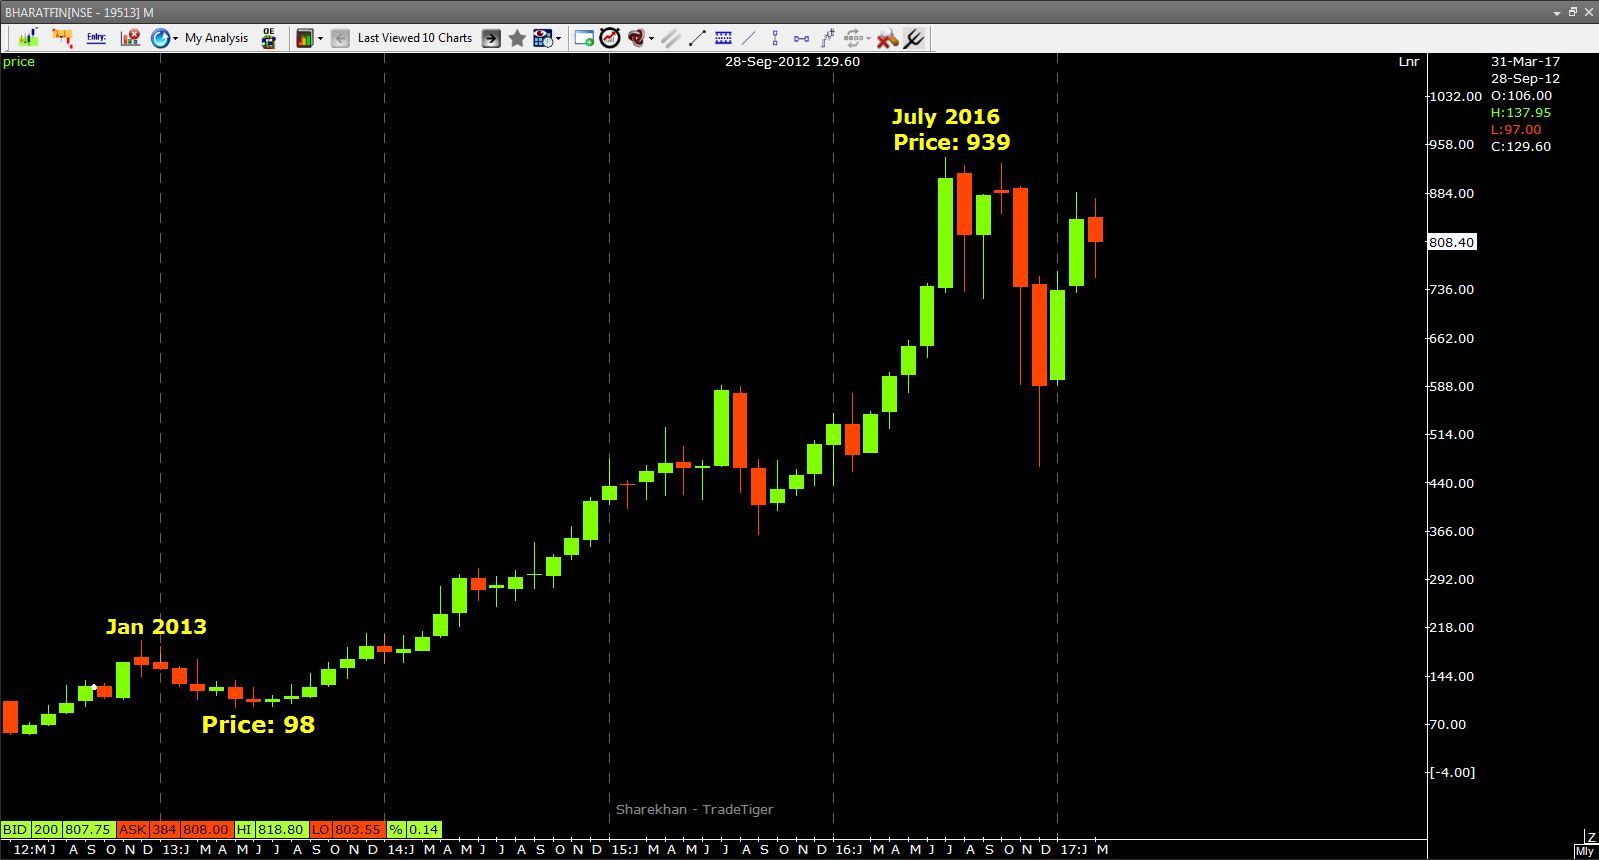
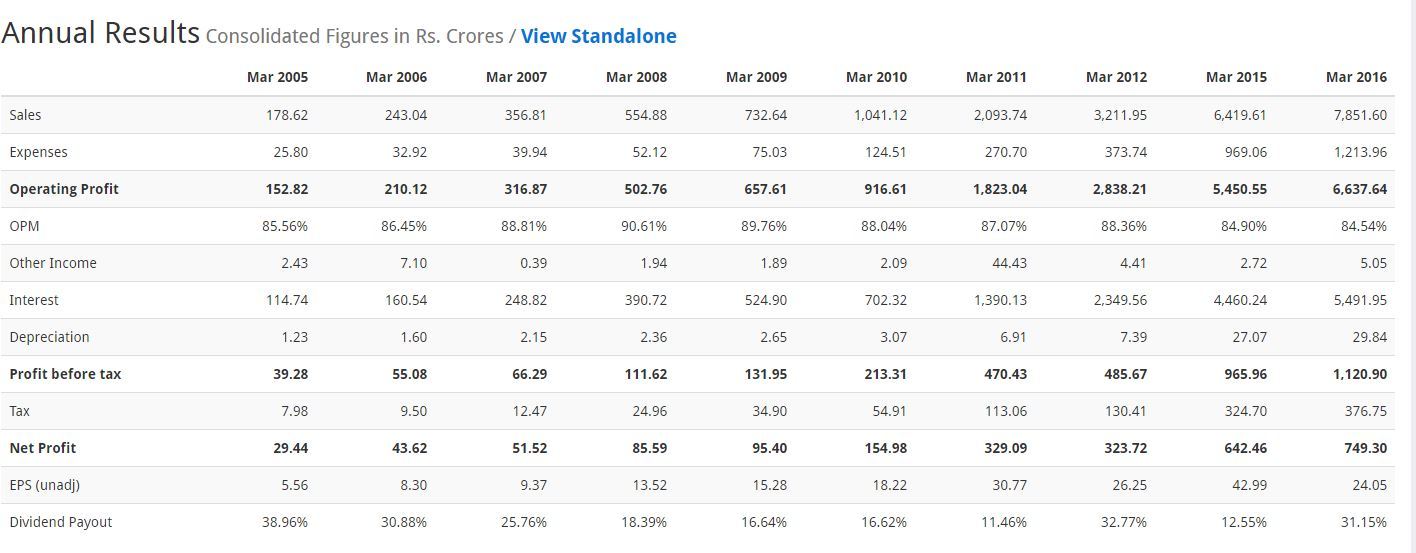
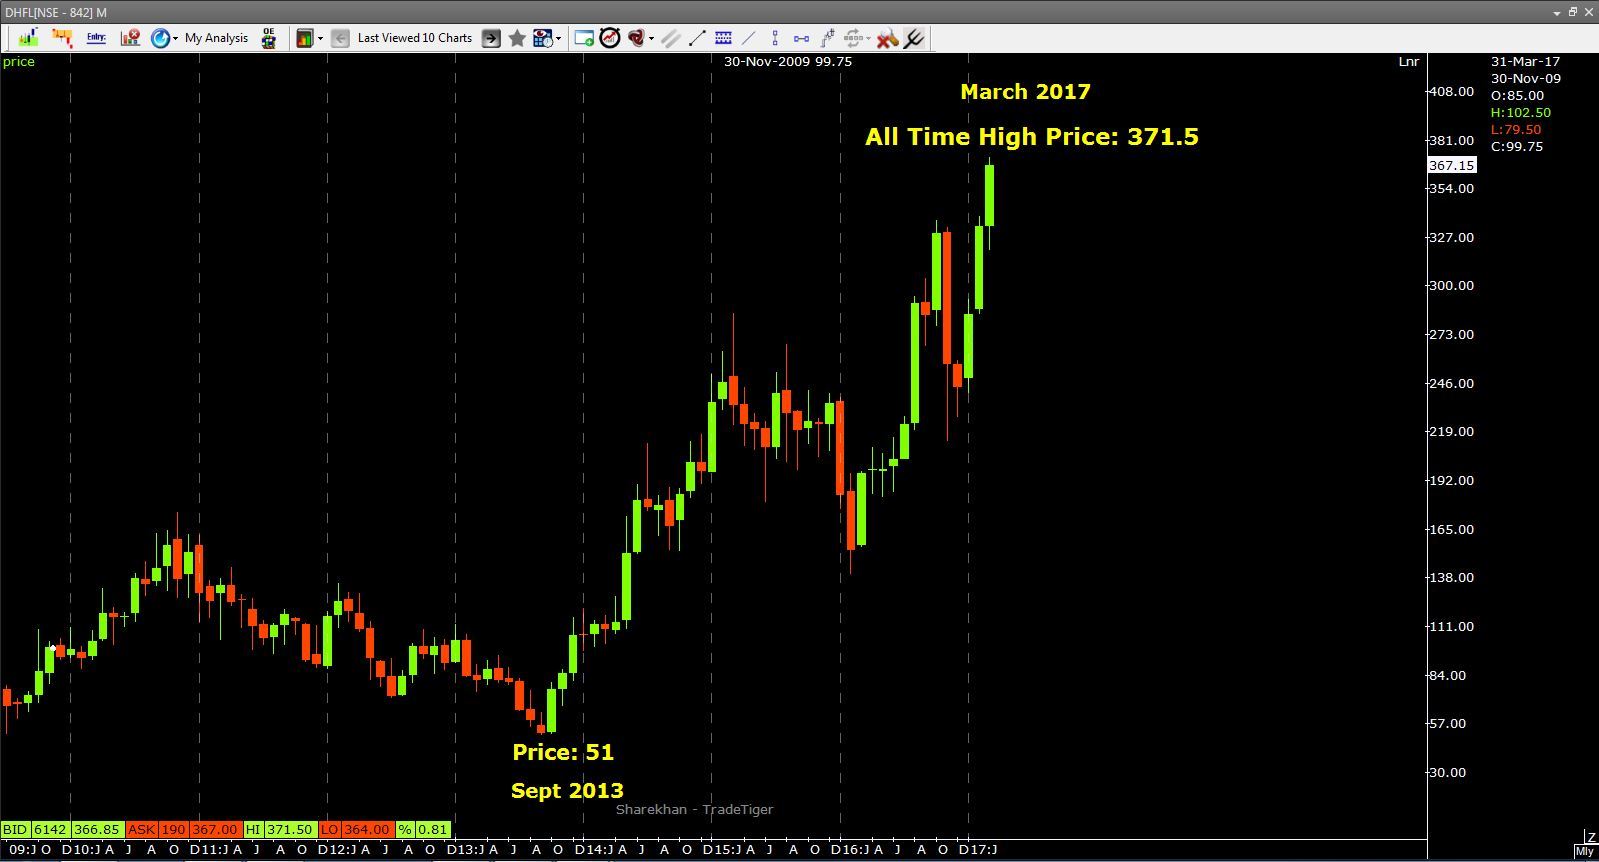
I came across Bharat Financial Inclusion Ltd (BHARATFIN) and DHFL. Both of these companies have negative cash flows and have taken big debt. So ideally one should expect the earnings and stock price performance of both of these companies as downsized. But that is what not happened,both have rallied in last 3 years. Can you explain the reason why?
Here is Cashflow statement,Annual Result and Monthly chart of BHARATFIN:
Both the companies are in the lending business. Their raw material is cash. Now for them to lend more and more, then need to borrow more and more. The more money they have the more they can lend. Same with banks.
In fact I’d have been worried if their CF from FA was -ve or just a small positive number.
Hi, Thank you for replaying. So, all the banking and financial services company (BFSIs) will have(must have) large +ve CF from FA. The bigger the better,right?
Tell me if i’m right, Sum of Cash from OA+IA+FA = Cash or cash equivalent in hand/bank of the company?
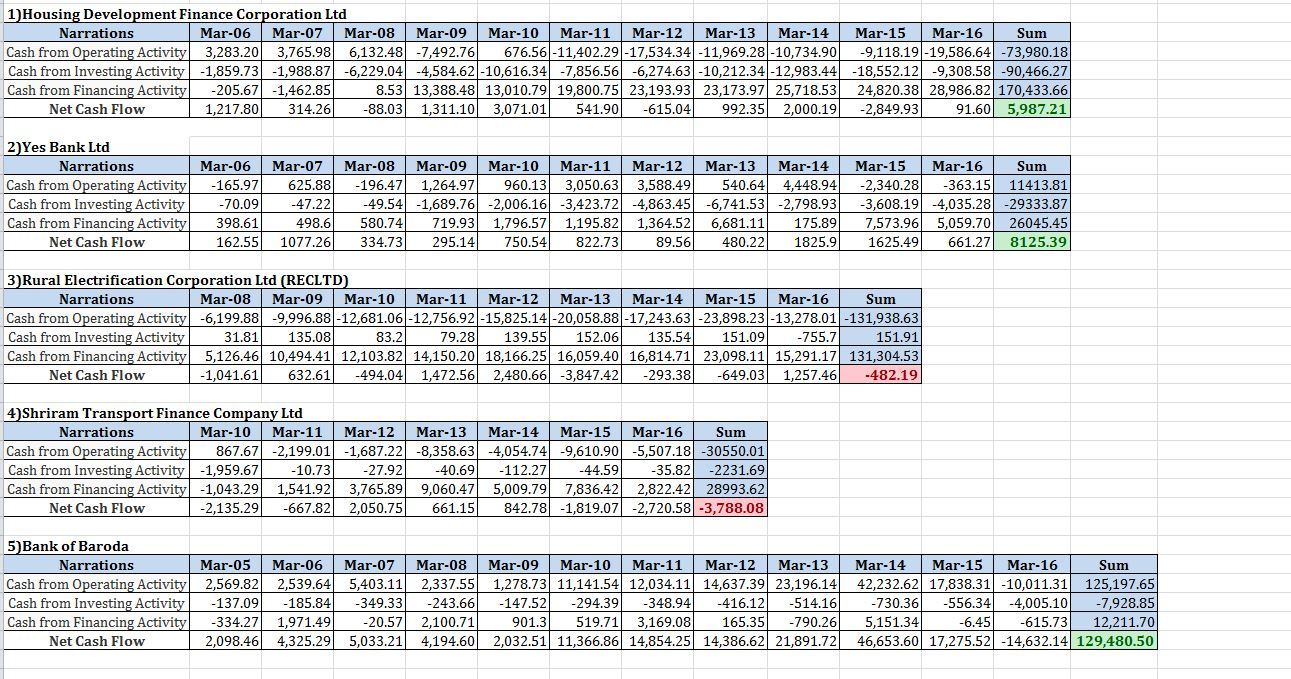
If yes, Help me understand CF of these 5 BFS companies.
HDFC - Has -ve CF from OA but has very large debt in FA and +ve sum of cash from all activities.
Yesbank - Has +ve CF from OA but large debt (But very less compared to HDFC) and sum of cash from all activities(Greater than HDFC).
Recltd - Has very large -ve CF from OA and Small +ve number for CF from IA and large debt. But the sum of cash from all activities is -ve number??
Srtransfin - Has -ve CF from OA, the sum of cash from all activities is -ve number(More -ve than REC)
Bob - It has small debt. So as you said bob will not be so good option for investment compared to others. So what does the large sum of cash from all activities represent?
You can get it from https://www.screener.in/ or http://www.ratestar.in/ Just type the name of the script you want CF for and it will show you the same. Look for consolidated numbers. And you need to copy paste each number to excel sheet and apply addition formula (As shown by Karthik in the video).
Yes[quote=“Learner, post:15, topic:11894”]
If yes, Help me understand CF of these 5 BFS companies
[/quote]
Banking is not really my strength. I may mislead you if I try to comment on this. You need to read these along with the notes associated in the annual report.
There are some websites like screener.in that give you basic data in a standard format. But if you want to go into detailed data of financial statements I would recommend buying software’s like acequity or capital line.
Again, Thank you so much Karthik. This CF analysis will help me improve my stock selection.
I have one suggestion,if you are planning to do next webinars on CF statement do consider one as sector wise. Showing good and bad CF statements from every sector. i.e. What to expect and not from a company.(from particular sector)
As smallcase are pre-selected stocks based on some strategy, what should be a user’s personal step as final check before investing?? I mean if you have to invest in a smallcase (let’s say “magic formula”), would you apply some kind of a final fundamental analysis before investing??
Should we approach smallcase investing the same way as with mutual funds? Or should we wait for next rebalancing of it before buying??