Also indicators can be saved under templates.
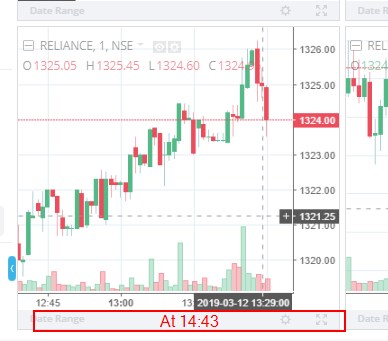
Doesn’t look like the issue has been resolved, 1 min candle stuck @ 13.29 as shown below.
@nithin, @siva-reddy Refresh issue is still there in TV charts, also prices shown are incorrect. I wonder you’ve done so many months of testing but these basic issues are cropping up…pls do take action.
Hi,
Is there a way I can plot/mark the executed trades on the chart? To review where all trades were executed?
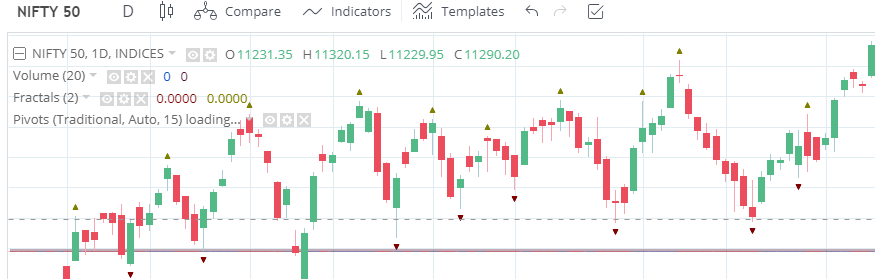
@nithin, @siva-reddy pivots are also not loading on daily timeframe…see screen. Also, TV provides various pivots but you’ve only enabled traditional…
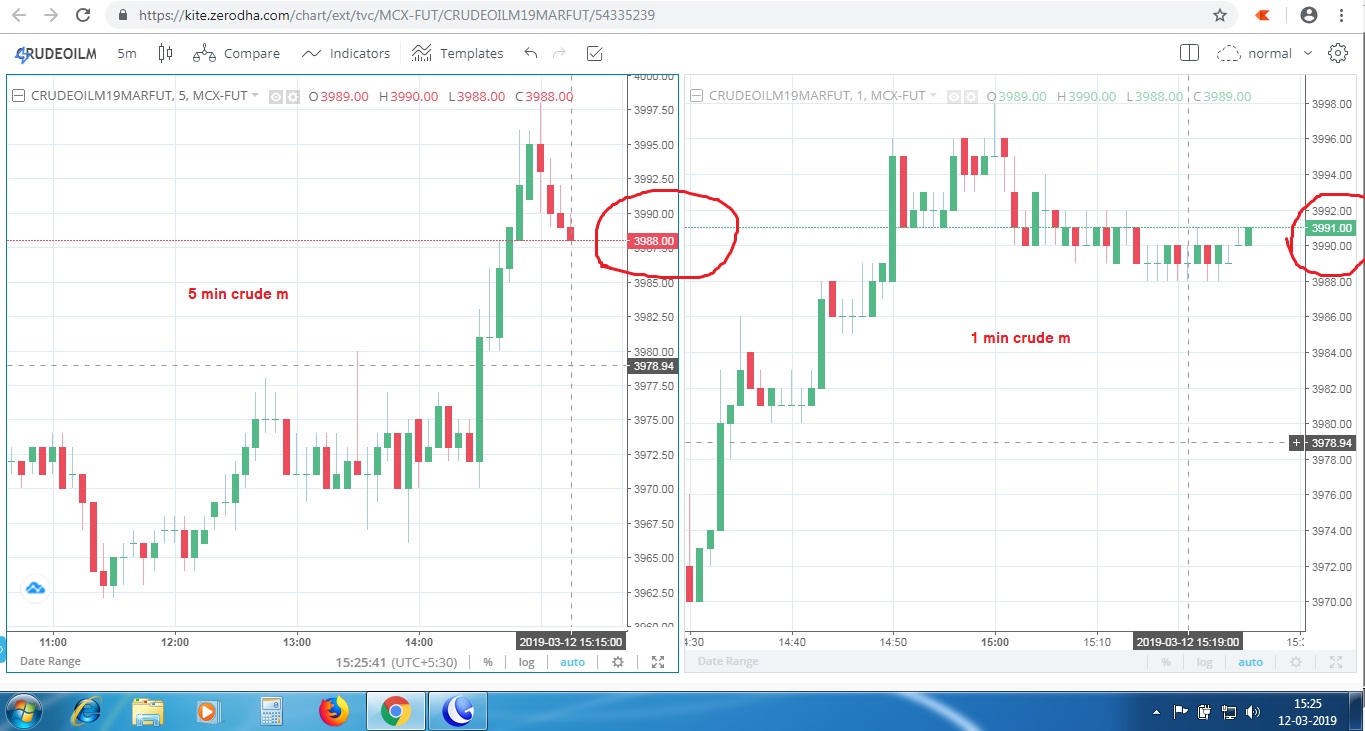
on TV multiple layouts , if same script with different time charts are placed then only one chart will be update other will stuck please look in to it
pic attached
yes, even i’m having this issue…i guess they have not done proper testing inspite of taking several days/months.
Something went off in deployment, also you can open and keep number of charts, this can happen in one case, we got it and will be fixed in a day or two, as this is in beta and you can use chartiq till then. Thanks.
We got the issue and will be addressed in a day or two, you can use chartiq till then, thanks.
We got the root cause and it is not a general case, will be addressed in a day or two, till then can use chartiq, thanks.
facing same issue in chartiq
hi @nithin @siva-reddy
zerodha is giving TV charts as beta test version right ?
if we clients use chartiq then what is the purpose of beta version?
we are spotting issues and informing you without getting any salary or benefit.
even not a simple “thanks” word from your boss @nithin
but @siva-reddy you are getting salary for identifying and solving these problems but you are not doing your work " just typing use chartiq" ;; If you spotted and solved these issues then we clients will not post these posts
good luck siva
You have joined this group 4 days ago and gave us good feedback from day 1 on different issues, on this point only you have mentioned thrice, So, I thought this may be distracting you from your trading and suggested to use chartiq till this is sorted, I have recommended to use chartiq to users only who has reported this on multiple times. we appreciate yours and all other users participation. It really help us.
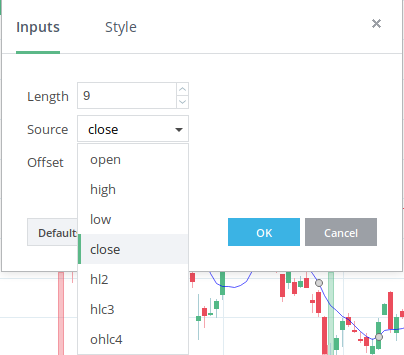
@siva-reddy one major feature gone missing . there is no option to add indicators to indicators . for example moving average to volume or moving average to rsi :
This is noted.
2 Likes
There is no 2hour 4hour candle option. Please add 2&4 hour candles. This will be helpful for commodity trading.
In our list of things to add.
is the data issue noted as i have mentioned in my previous post?
Dont you think that is important to day traders.
I simply cannot believe such a callous and careless attitude towards such a glaring issue.
Please acknowledge this issue and do something about it.
chartiq or TV is not going to help day traders if data is all wrong.
I still have to use amibroker + GDFL for data.
What is the point of launching TV?
Thanks ![]()
1 Like
Firstly, it is not feasible for us to tie up with a data vendor and stream data on charts - both technically and in terms of costs.
Btw, the data stream should already be very similar. I had answered it before
If you take what data vendor provides and compare it to tick by tick data on colo, the TBT data captures all the ticks. And impossible technically to stream all ticks that happen on the exchange. You can’t then say what data vendor provides as data is wrong.
Btw, I have done this professionally for two decades, I know tons of profitable traders, many of them technical analysts. I can’t think of one person who cared/cares for all ticks to be captured on their charts. It doesn’t really matter. Stray ticks without volume actually is bad for the chart which is typically what will not get captured if not using Tick by Tick data feed.
1 Like