Very interesting, people don’t see charts off market hours!
Not sure about after hours chart but the chart often skips some candles of the past few minutes during market hours. For eg if I open a chart at 2:25 pm the latest candle will be from 2:17 pm. I need to reopen the chart a few times to get the latest candles.
Though I am not a coder myself still giving my personal view on this,every platform uses different technology, different architecture so I believe we shouldn’t compare with others. But I can say we use latest technology in building our in-house products.
Will get this checked though not promising anything in this regard.
Nothing as such, I can confidently dismiss this claim.
Were you not able to view now?
I believe this might be specific to you, we can help you if you can write to [email protected] with screenshot.
Kite 2 is showing subscribed apps but Kite 3 is not showing subscribed apps. I don’t know whether it is because of Kite 3 is in beta mode but Zerodha should rectify this.
I can’t see it…
Check the screenshot
It’s hourly chart of nifty
Market place shows at end 20th nifty is 10360.40
While the screenshot
It shows the close of 19.2.2017
I can’t fetch or see what happened on 20th!
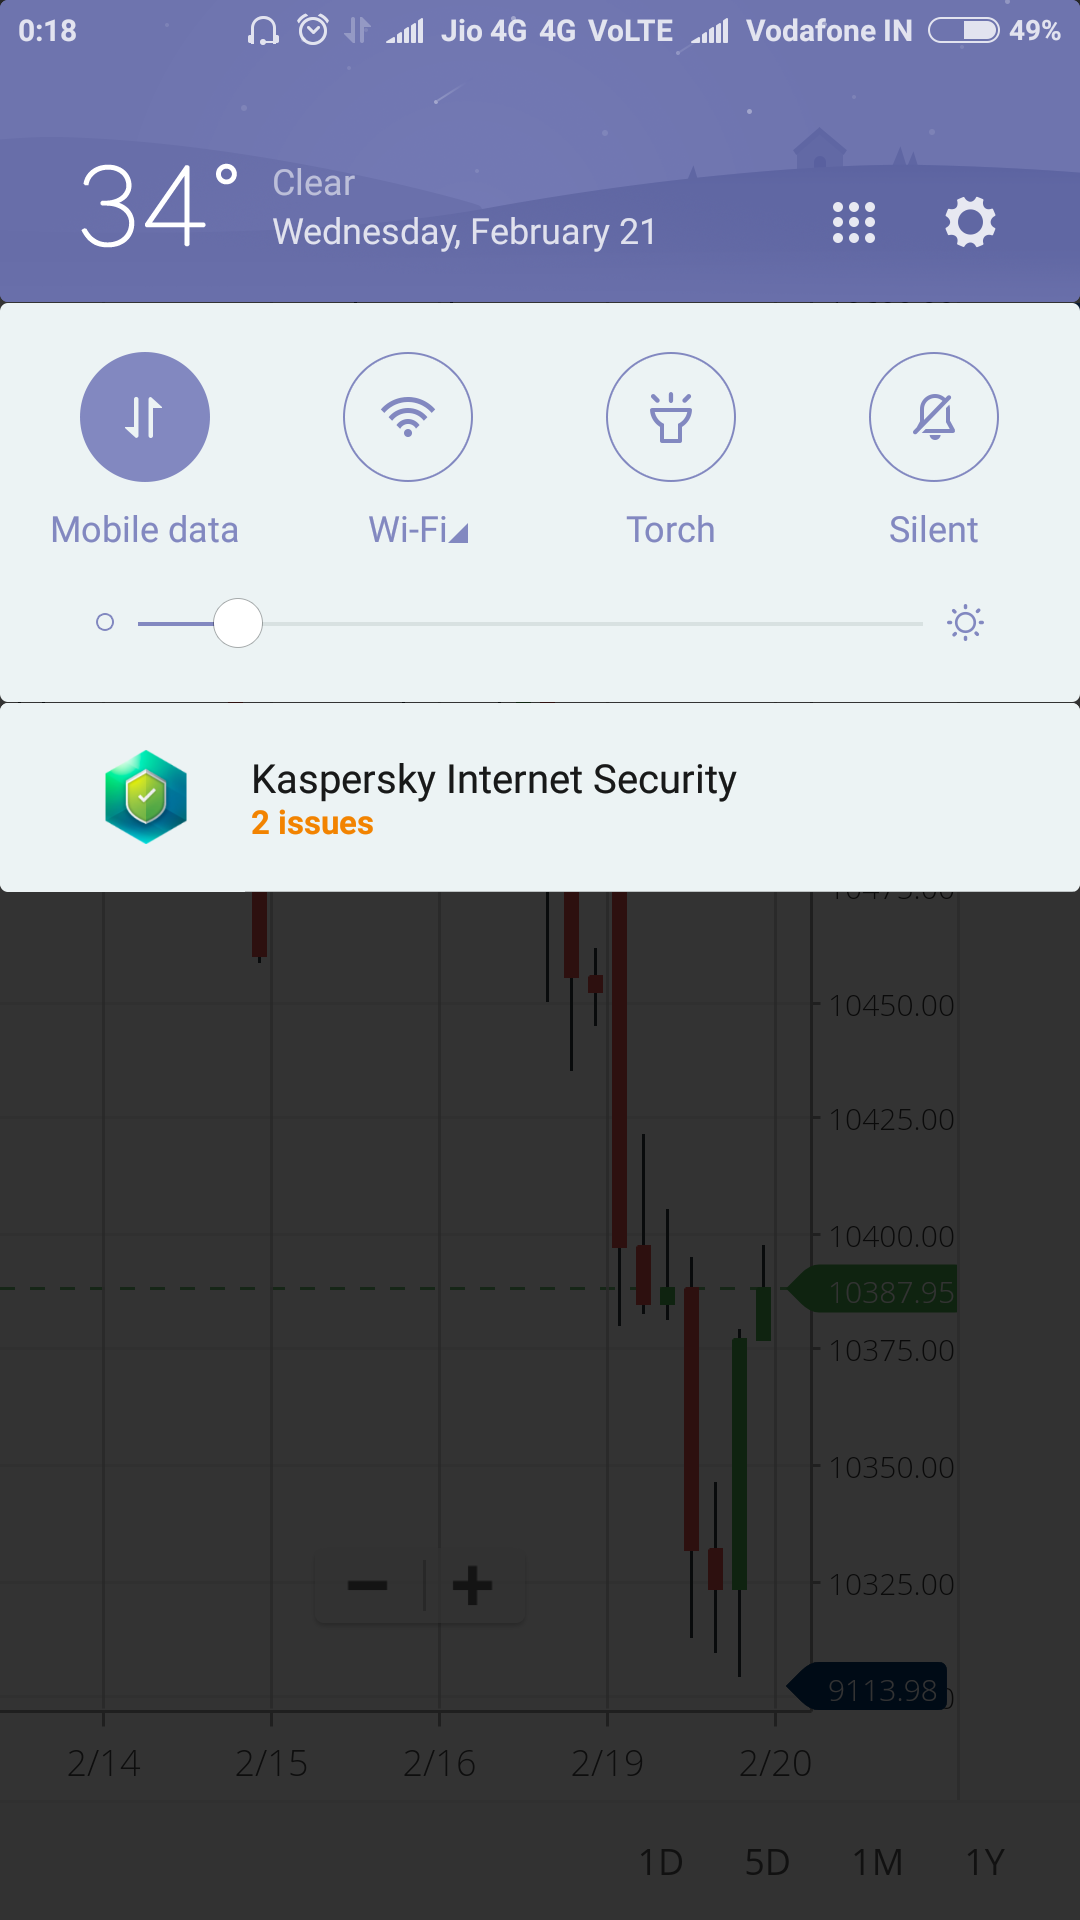
At night times zerodha updates databases hence latest day is not displayed I think between 1 a.m. night to 4 a.m. morning
@siva-reddy
Plz do check the HTML 5 platform of rksv upstox. Pro.upstox.com.
They also use chartiq. But in there platform there is no need to add a Scrip to MarketWatch.
@siva-reddy
The feature of sliding the chart candle by candle by arrow key is not functioning. It was great for backtesting. Why is it not working anymore? Can we expect it back soon? Because without it backtesting is nearly impossible.
TIA
It should work, I think the chart frame is not selected by you, can you click on any one option of chart menu like display or studies and then try to navigate candle by arrow keys and confirm.
@siva-reddy
Thanks for prompt reply again.
I checked by clicking on multiple locations on chart.
The clicking on chart, studies etc wont work.
But to activate the mechanism on e need to click on anywhere on tool bar above!
Between, have you checked out upstox?? 
It’s always good to keep an eye on rivals and try to make up with them.
We wont ask for an overhaul of kite - but widget based environment is super cool, isn’t it?
@siva-reddy
Also remove that studies button from multi charts.
Useless and creates lots of problems as it gets activated just by mouse rollover.
TIA
Will check on this.
Does Kite3 platform charts shows false signals?
I am new to trading but in general, even a layman can see Kite3 charts generating false signals most of the times, the fluctuating highs and lows in candlesticks. I compared to Kite2 charts where I got the correct signals for the same set of parameters.
Is there a way to solve it as refreshing every minute or so is not more of a viable option?
Can you use kite2 charts only for time-being.
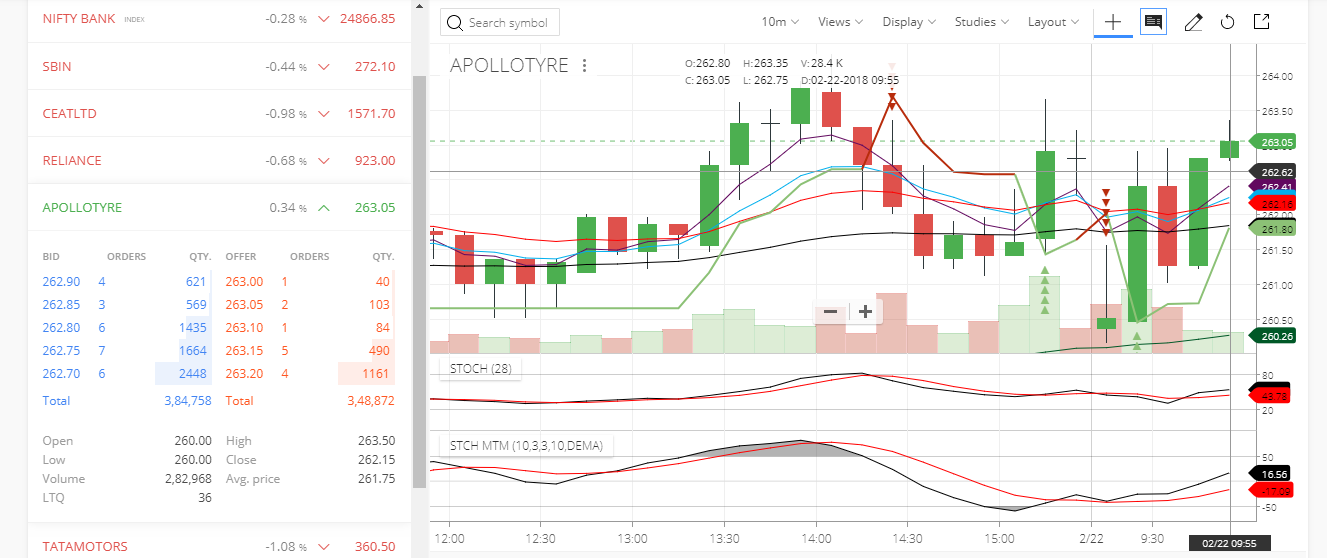
Here Is Apollo Tyre Charts (Time Frame 10 Min)
The Stock Quote Showing High Of 263.50 And The Latest Candle Which Is Of High Is Showing the High Of 263.35.
Why This Happen’s In The Chart. We Want The Price Which Are Live Note The False One.
Why The Price Is Difference. It Need’s Clarification. @siva-reddy @nithin